. 2010 May;13(5):592-600.
doi: 10.1038/nn.2517. Epub 2010 Mar 28.

Reduction in endocannabinoid tone is a homeostatic mechanism for specific inhibitory synapses

Affiliations

Reduction in endocannabinoid tone is a homeostatic mechanism for specific inhibitory synapses

Jimok Kim et al. Nat Neurosci. 2010 May.

Abstract

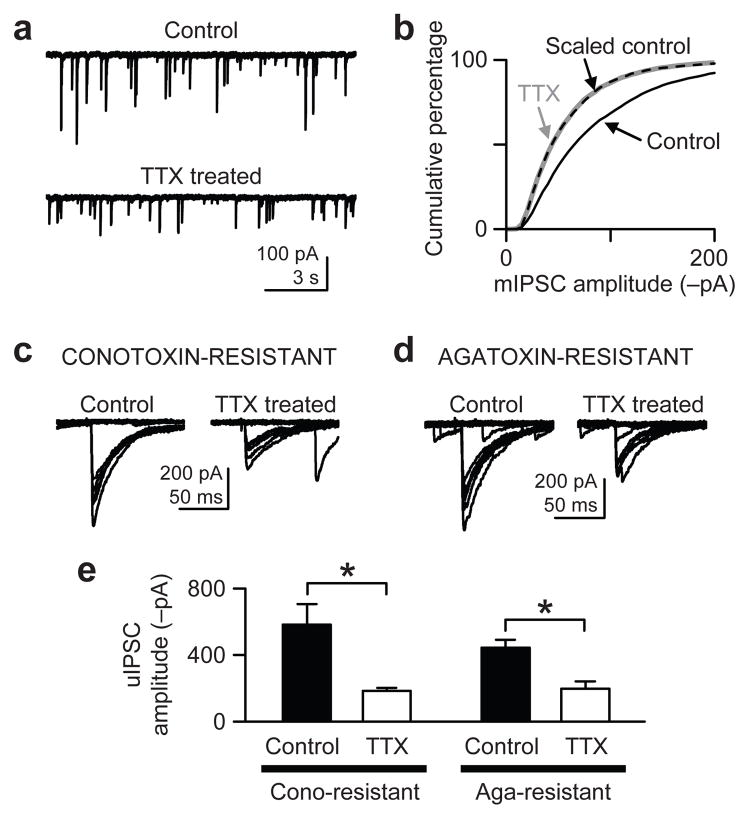
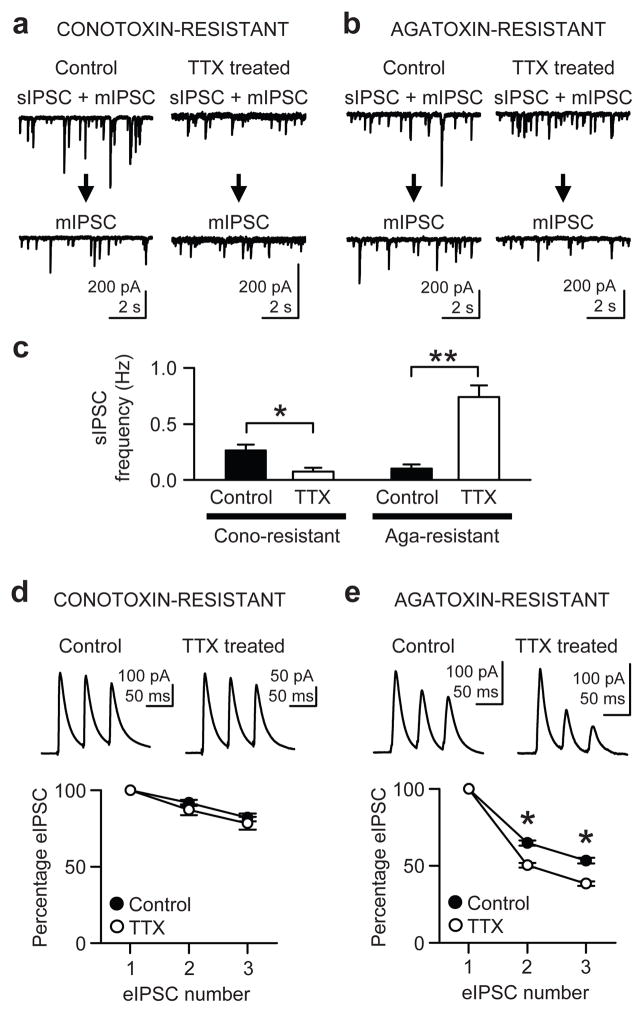
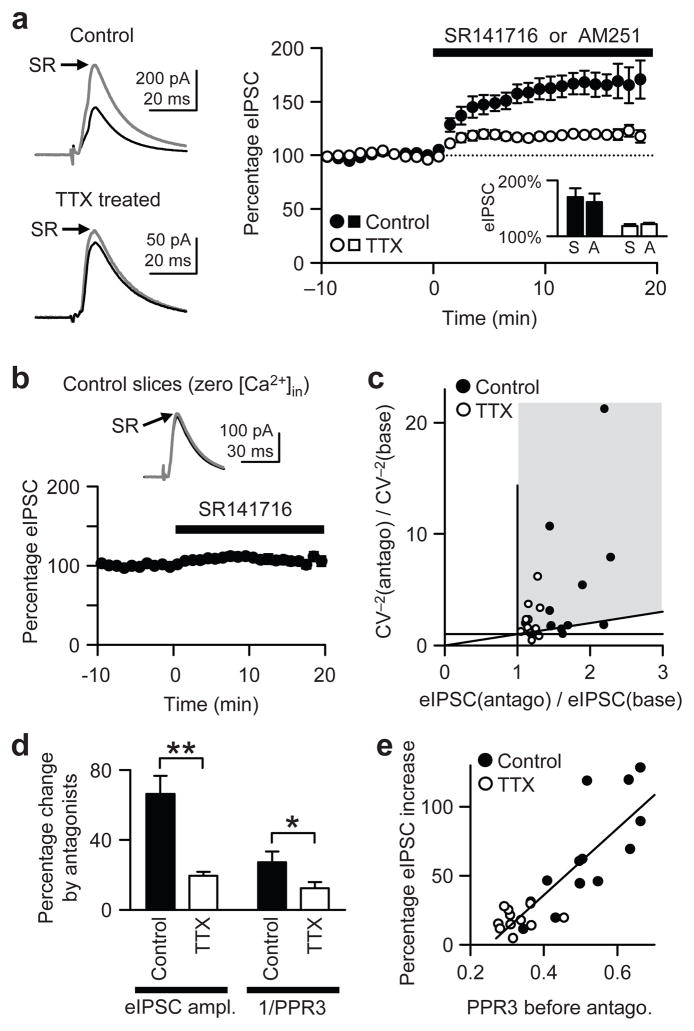
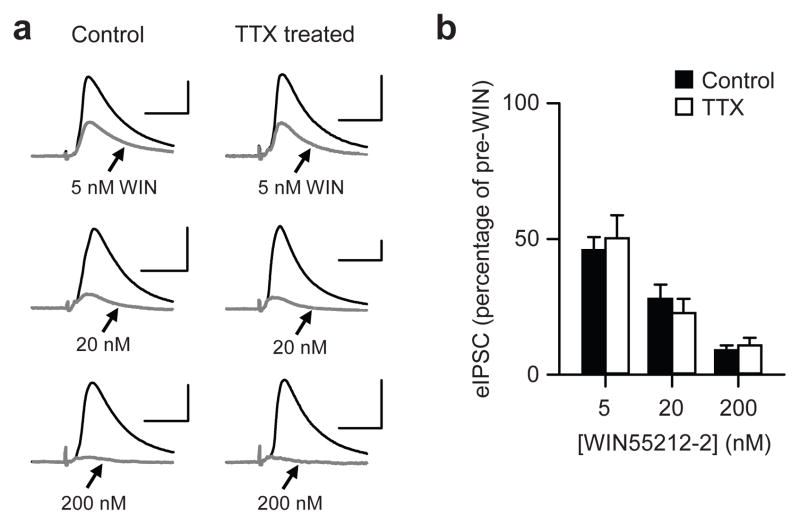
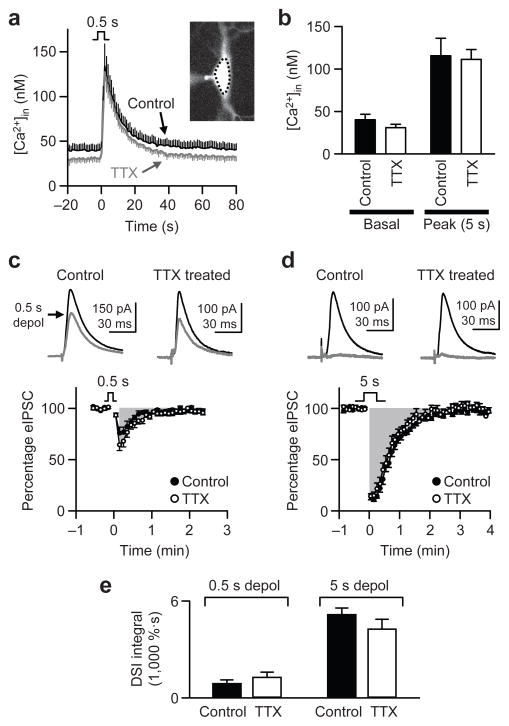
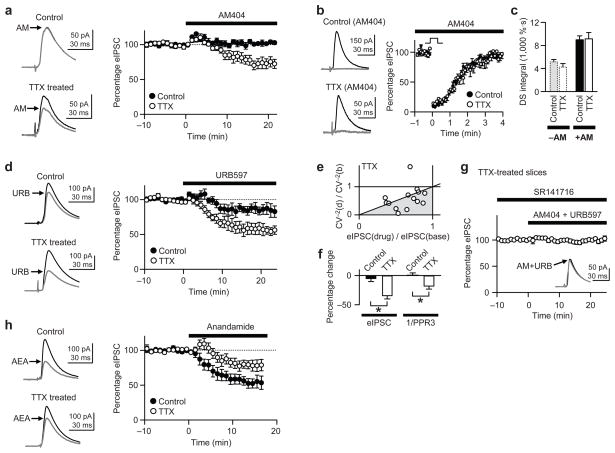
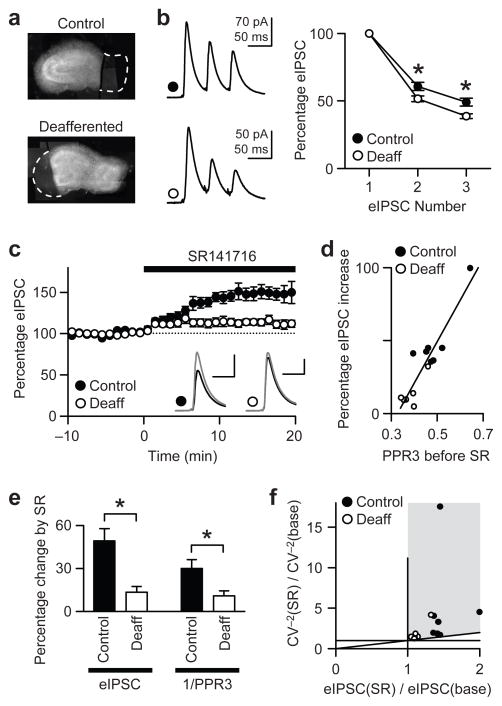
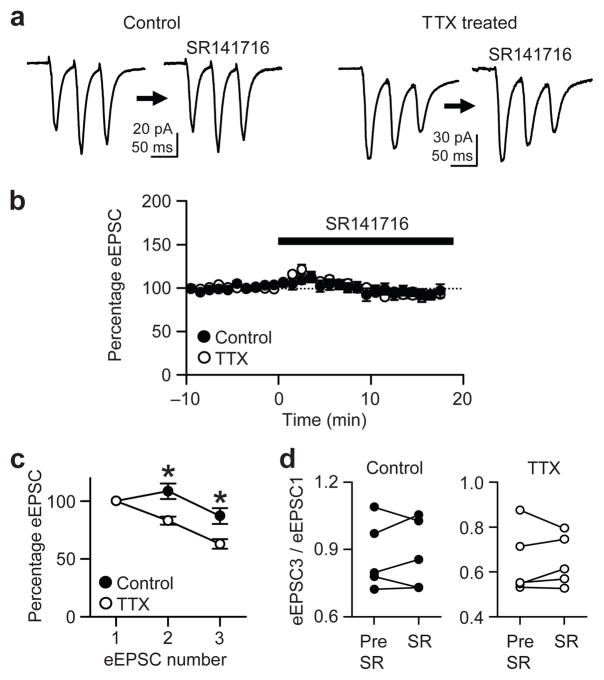
When chronic alterations in neuronal activity occur, network gain is maintained by global homeostatic scaling of synaptic strength, but the stability of microcircuits can be controlled by unique adaptations that differ from the global changes. It is not understood how specificity of synaptic tuning is achieved. We found that, although a large population of inhibitory synapses was homeostatically scaled down after chronic inactivity, decreased endocannabinoid tone specifically strengthened a subset of GABAergic synapses that express cannabinoid receptors. In rat hippocampal slice cultures, a 3-5-d blockade of neuronal firing facilitated uptake and degradation of anandamide. The consequent reduction in basal stimulation of cannabinoid receptors augmented GABA release probability, fostering rapid depression of synaptic inhibition and on-demand disinhibition. This regulatory mechanism, mediated by activity-dependent changes in tonic endocannabinoid level, permits selective local tuning of inhibitory synapses in hippocampal networks.


Figures

Figure 1
Figure 1
Homeostatic downregulation of inhibitory synapses caused by chronic TTX treatment. (a) Whole-cell recordings of mIPSCs from CA1 pyramidal neurons in control and TTX-treated (3–5 days) slice cultures of rat hippocampus. Cells were voltage-clamped at −65 mV with a pipette solution containing 142.4 mM Cl. (b) Cumulative distributions of mIPSCs (500 events per cell) show that chronic TTX reduced mIPSC amplitudes. The distribution of the scaled control data (dashed line), obtained after scaling down individual mIPSCs (see Methods), essentially overlapped exactly with the TTX-treated mIPSC distribution (thick gray line) (P > 0.9, Kolmogorov-Smirnov test between TTX and Scaled control), suggesting a global scaling of mIPSCs. (c) uIPSCs were evoked by extracellular minimal stimulation. Stimulus intensity was gradually increased until uIPSCs were elicited in an all-or-none fashion and consistently occurred, as shown in the sample traces. Slice cultures were preincubated with 500 nM ω-conotoxin GVIA for 15–30 min just before recording to isolate synapses that use P/Q-type Ca2+ channels for GABA release. (d) Same experiment as in c, but the slice cultures were preincubated with 300 nM ω-agatoxin IVA for 15–30 min. (e) Group data of uIPSC amplitudes show the mean amplitudes were reduced by chronic TTX in both conotoxin- and agatoxin-resistant synapses. *, P < 0.02. Error bars represent s.e.m. in this and all other figures.
Figure 2
Figure 2
Inactivity-induced upregulation of synaptic properties in a subset of inhibitory interneurons. (a) sIPSCs were recorded at −65 mV with 142.4 mM Cl in the pipette solution. In each cell, first a mixture of sIPSCs and mIPSCs was recorded and then, after addition of 0.5 μM TTX, only mIPSCs were obtained. sIPSC frequency was found by subtracting the frequency of mIPSCs from the total of sIPSCs + mIPSCs in the same cell. Slice cultures were preincubated in 500 nM ω-conotoxin GVIA for 15–30 min. (b) Same experiment as in a, but the cultures were preincubated with 300 nM ω-agatoxin IVA for 15–30 min. (c) Group data of sIPSC frequency. *, P < 0.02. **, P < 0.0005. (d) Short-term plasticity of eIPSCs was examined with extracellular stimulation of presynaptic axons at 20 Hz. In this and all subsequent experiments, pipette [Cl] was lowered to 1.4 mM, which kept eIPSC amplitudes small and preserved adequate voltage clamp control. Slice cultures were preincubated with ω-conotoxin GVIA for 15–30 min. Amplitudes of the second and the third eIPSCs were normalized to the first eIPSCs. No difference was found between control and TTX-treated cells in short-term depression of eIPSCs from P/Q-type Ca2+ channel-containing terminals (P > 0.2). (e) Short-term depression of eIPSCs from terminals with N-type Ca2+ channels was measured after preincubation with ω-agatoxin IVA for 15–30 min. TTX-treated cells showed more pronounced depression, suggesting an increase in Pr. *, P < 0.001.
Figure 3
Figure 3
Tonic activation of CB1R is reduced by activity deprivation. (a) Mean amplitude of agatoxin-resistant eIPSCs was enhanced by a CB1R antagonist, either SR141716 (2 μM) or AM251 (2 μM). Black traces, averaged eIPSCs before SR141716; gray traces, averaged eIPSCs in SR141716. In the right graph, eIPSC amplitudes were normalized to baseline values before SR141716. Inset, effects of SR141716 (S) were not significantly different from those of AM251 (A) in either control or TTX groups (P > 0.5). (b) SR141716 (2 μM) failed to increase eIPSCs in control slices when a zero-Ca2+ pipette solution was used for recording. (c) From the data in a, the ratio of CV−2 in CB1R antagonist to baseline CV−2 [CV−2(antago)/CV−2(base)] is plotted against the ratio of eIPSC amplitudes in CB1R antagonist to baseline values [eIPSC(antago)/eIPSC(base)]. Data points in gray area and along the diagonal line of y = x imply a presynaptic enhancement of transmission caused by either SR147161 or AM251. (d) The larger increase in eIPSC caused by CB1R antagonists in control cells than in TTX-treated cells, is accompanied by a larger increase in PPR3−1, which is proportional to Pr. Data in a were analyzed. *, P < 0.05. **, P < 0.01. (e) The eIPSC increase induced by a CB1R antagonist is plotted against PPR3 before the antagonist. When PPR3 was high (low basal Pr), the eIPSC increase was larger. Straight line is a linear fit with square of correlation coefficient (R2) of 0.71.
Figure 4
Figure 4
Chronic inactivity does not alter the responsiveness of CB1R to WIN55212-2, a CB1R agonist. (a) Representative traces of agatoxin-resistant eIPSCs from three control and three TTX-treated cells at different concentrations of WIN55212-2 (5, 20, and 200 nM). Black, average of baseline eIPSCs before WIN55212-2; gray, average of steady-state eIPSCs in the presence of WIN55212-2. All scale bars, 100 pA and 20 ms. (b) eIPSC amplitudes in the presence of WIN55212-2 were normalized to the pre-WIN55212-2 baseline. No significant difference was found between the responses of control and TTX-treated cells at any concentration (P > 0.4).
Figure 5
Figure 5
Basal [Ca2+]in and Ca2+-dependent 2-AG release are not affected by chronic TTX. Slice cultures were preincubated with 300 nM ω-agatoxin IVA for 15–30 min. (a) Somatic [Ca2+]in in postsynaptic cells was imaged at 1 Hz with 200 μM Fura-2 in the pipette solution. Pyramidal cells were depolarized to 0 mV for 500 ms at time 0. Inset, somatic fluorescence was summed within the dotted line. (b) Basal [Ca2+]in was averaged in the baseline period before depolarization. Average peak [Ca2+]in was measured for 5 s starting from the peak. Neither parameter differed significantly between control and TTX-treated cells (P > 0.2). (c) Changes in eIPSC amplitudes after 500 ms depolarizations were recorded simultaneously with Ca2+ imaging. Black trace, average of eIPSCs before depolarization; gray trace, average of the second and third eIPSCs after depolarization. Bottom graph shows group data of DSI with 500 ms depolarization. The gray area represents integration of eIPSC suppression (the DSI integral) from 6 to 144 s. (d) DSI with 5 s depolarization to 0 mV. The DSI integral was obtained from the gray area in the range of 0–240 s. Gray trace, average of the first three eIPSCs after depolarization. (e) Group data of DSI integrals show no difference between control and TTX-treated groups with either 500 ms or 5 s depolarization (P > 0.2).
Figure 6
Figure 6
Uptake and degradation of basal endocannabinoid are enhanced by activity deprivation. All slice cultures were preincubated with 300 nM ω-agatoxin IVA for 15–30 min. (a) AM404-mediated suppression of eIPSC is significantly larger in TTX-treated neurons than in control cells (P < 0.005). Right: representative traces of eIPSCs averaged before (black) and during (gray) application of 20 μM AM404, an endocannabinoid transporter inhibitor. (b) In the presence of AM404 (20 μM), the magnitudes of DSI (0 mV, 5 s) in control and TTX-treated cells were similar. Black traces, before depolarization; gray traces, average of the first three eIPSCs after depolarization. (c) DSI integral with 5 s depolarization did not differ between control and TTX-treated cells in the absence (−AM) or presence (+AM) of AM404, whereas AM404 increased DSI in each group. The dotted bars on the left were replotted from Figure 5e for comparison. (d) URB597-mediated suppression of eIPSC was significantly greater in TTX-treated cells than in control (P < 0.02). Right: representative traces of averaged eIPSCs showing the effect of 1 μM URB597 (gray traces). (e) From the data in a and d, the ratio of CV−2 in AM404 or URB597 to baseline CV−2 [CV−2(drug)/CV−2(base)] was plotted against the ratio of eIPSCs [eIPSC(drug)/eIPSC(base)]. Points in gray area and along the diagonal line imply presynaptic suppression of eIPSC by either AM404 or URB597. (f) The larger reduction in eIPSC amplitudes by AM404 or URB597 in TTX-treated cells is accompanied by a larger decrease in PPR3−1, which is proportional to Pr. *, P < 0.005. (g) A cocktail of AM404 (20 μM) and URB597 (1 μM) did not suppress eIPSCs in the presence of 2 μM SR141716, indicating that AM404 and URB597 in a and d acted via CB1Rs. Inset: representative traces of averaged eIPSCs in the absence (black) or presence (gray) of the cocktail. (h) Bath-applied anandamide (720 nM) reduced eIPSCs to a lesser extent in TTX-treated cells than in control cells (P < 0.05). Right: averaged traces before and during (AEA) anandamide application. Ca2+ was excluded from the pipette solution to prevent FAAH from being occupied by endogenous anandamide.
Figure 7
Figure 7
Deafferentation of CA1 decreases tonic CB1R activity and increases basal GABAergic Pr, mimicking chronic TTX treatment. All slice cultures were incubated with ω-agatoxin IVA (300 nM) for 15–30 min prior to recording. (a) Micrographs of cultures from which CA3 or subiculum had been removed. CA3 removal eliminates afferent excitation of CA1 neurons, whereas subiculum removal serves as control. Dashed lines indicate the areas removed. (b) Short-term eIPSC depression (20 Hz) is more pronounced in deafferented slices than in control slices. Recordings were made 5–7 days after the cut. *, P < 0.05. (c) The increase in eIPSCs caused by SR141716 (2 μM) is larger in control cells than in deafferented cells (P < 0.005). Black trace, baseline; gray trace, SR141716. Amplitude scales, 50 pA for control and 100 pA for deafferented. Time scales, 30 ms. (d) When basal Pr is lower, as represented by higher PPR3 before SR141716, the SR141716-mediated increase in eIPSCs is larger. The line is a linear regression fit (R2 = 0.84). (e) The larger enhancement in eIPSC amplitudes caused by SR141716 in control cells than in deafferented cells is accompanied by a larger increase in PPR3−1. Data in b and c were analyzed. *, P < 0.05. (f) From the data in c, the ratio of CV−2 in SR141716 to baseline CV−2 [CV−2(SR)/CV−2(base)] is plotted against the ratio of eIPSCs. Points in gray area and along the diagonal line suggest presynaptic enhancement of transmission.
Figure 8
Figure 8
Chronic TTX enhances Pr of excitatory synapses independently of tonic endocannabinoid action. (a) Averaged traces of eEPSCs before and during SR141716 (2 μM) application. SR141716 had no effect on the amplitude of eEPSCs recorded from CA1 pyramidal neurons. (b) Group data, normalized to pre-SR141716 baseline, show that SR141716 caused no significant changes in eEPSCs in either treatment group. (c) Short-term plasticity of eEPSC was assessed with 20 Hz stimulation. TTX-treated cells displayed more rapid depression. The second and the third eEPSCs were normalized to the first eEPSC amplitude. *, P < 0.005. (d) The ratios of eEPSC3/eEPSC1 were not significantly different before (Pre-SR) or in the presence of (SR) 2 μM SR141716 in either treatment group, implying the increased glutamatergic Pr (represented by eEPSC3/eEPSC1) was independent of CB1Rs. Each dot indicates individual cell.

Similar articles

Cited by

References

    1. Turrigiano GG. The self-tuning neuron: synaptic scaling of excitatory synapses. Cell. 2008;135:422–435. - PMC - PubMed
    1. Houweling AR, Bazhenov M, Timofeev I, Steriade M, Sejnowski TJ. Homeostatic synaptic plasticity can explain post-traumatic epileptogenesis in chronically isolated neocortex. Cereb Cortex. 2005;15:834–845. - PMC - PubMed
    1. Trasande CA, Ramirez JM. Activity deprivation leads to seizures in hippocampal slice cultures: is epilepsy the consequence of homeostatic plasticity? J Clin Neurophysiol. 2007;24:154–164. - PubMed
    1. Kim J, Tsien RW. Synapse-specific adaptations to inactivity in hippocampal circuits achieve homeostatic gain control while dampening network reverberation. Neuron. 2008;58:925–937. - PMC - PubMed
    1. Bausch SB, He S, Petrova Y, Wang XM, McNamara JO. Plasticity of both excitatory and inhibitory synapses is associated with seizures induced by removal of chronic blockade of activity in cultured hippocampus. J Neurophysiol. 2006;96:2151–2167. - PubMed

Publication types

MeSH terms

Substances