

Targeting mutant p53 protein and the tumor vasculature: an effective combination therapy for advanced breast tumors
- PMID: 20349129
- PMCID: PMC2916972
- DOI: 10.1007/s10549-010-0851-x
Targeting mutant p53 protein and the tumor vasculature: an effective combination therapy for advanced breast tumors
Abstract
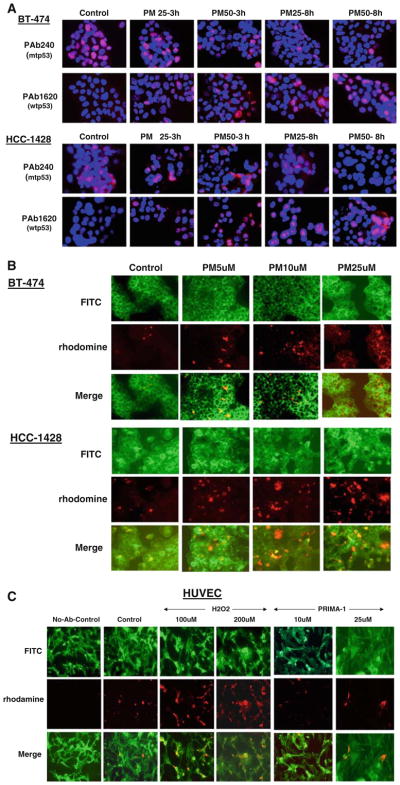
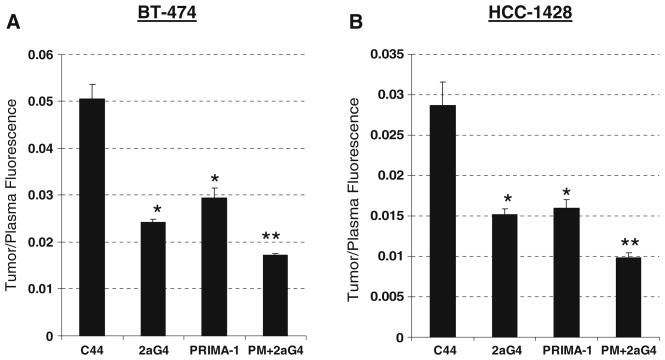
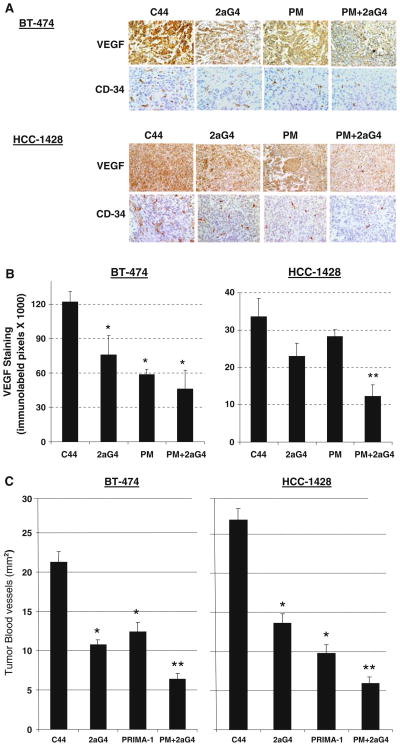
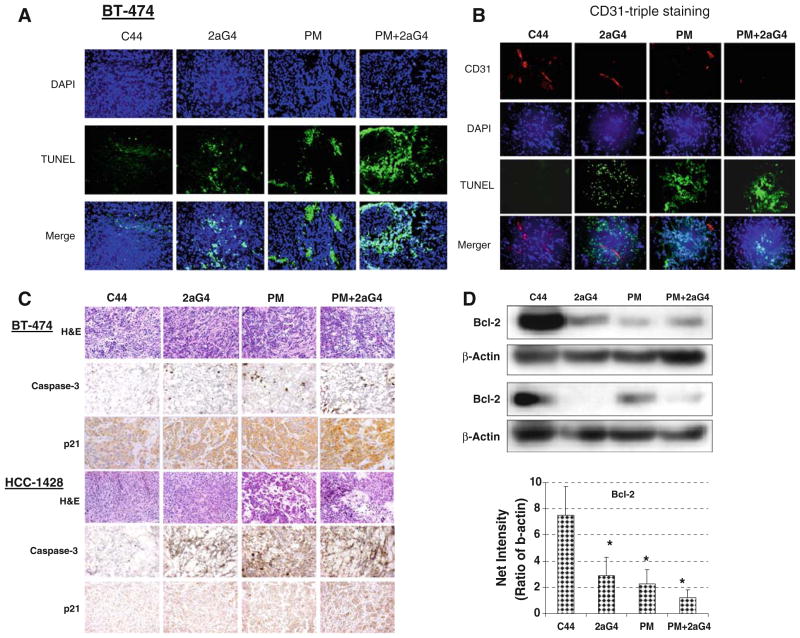
Breast cancer progression depends upon the elaboration of a vasculature sufficient for the nourishment of the developing tumor. Breast tumor cells frequently contain a mutant form of p53 (mtp53), a protein which promotes their survival. The aim of this study was to determine whether combination therapy targeting mtp53 and anionic phospholipids (AP) on tumor blood vessels might be an effective therapeutic strategy for suppressing advanced breast cancer. We examined the therapeutic effects, singly, or in combination, of p53 reactivation and induction of massive apoptosis (PRIMA-1), which reactivates mtp53 and induces tumor cell apoptosis, and 2aG4, a monoclonal antibody that disrupts tumor vasculature by targeting AP on the surface of tumor endothelial cells and causes antibody-dependent destruction of tumor blood vessels, leading to ischemia and tumor cell death. Xenografts from two tumor cell lines containing mtp53, BT-474 and HCC-1428, were grown in nude mice to provide models of advanced breast tumors. After treatment with PRIMA-1 and/or 2aG4, regressing tumors were analyzed for vascular endothelial growth factor (VEGF) expression, blood vessel loss, and apoptotic markers. Individual drug treatment led to partial suppression of breast cancer progression. In contrast, combined treatment with PRIMA-1 and 2aG4 was extremely effective in suppressing tumor growth in both models and completely eradicated approximately 30% of tumors in the BT-474 model. Importantly, no toxic effects were observed in any treatment group. Mechanistic studies determined that PRIMA-1 reactivated mtp53 and also exposed AP on the surface of tumor cells as determined by enhanced 2aG4 binding. Combination treatment led to significant induction of tumor cell apoptosis, loss of VEGF expression, as well as destruction of tumor blood vessels. Furthermore, combination treatment severely disrupted tumor blood vessel perfusion in both tumor models. The observed in vitro PRIMA-1-induced exposure of tumor epithelial cell AP might provide a target for 2aG4 and contribute to the increased effectiveness of such combination therapy in vivo. We conclude that the combined targeting of mtp53 and the tumor vasculature is a novel effective strategy for combating advanced breast tumors.
Conflict of interest statement
Figures


Similar articles
-
PRIMA-1 inhibits growth of breast cancer cells by re-activating mutant p53 protein.Int J Oncol. 2009 Nov;35(5):1015-23. doi: 10.3892/ijo_00000416. Int J Oncol. 2009. PMID: 19787255
-
Regression of progestin-accelerated 7,12-dimethylbenz[a]anthracene-induced mammary tumors in Sprague-Dawley rats by p53 reactivation and induction of massive apoptosis: a pilot study.Endocr Relat Cancer. 2009 Mar;16(1):85-98. doi: 10.1677/ERC-08-0069. Epub 2008 Dec 15. Endocr Relat Cancer. 2009. PMID: 19075036
-
Re-activation of the p53 pathway inhibits in vivo and in vitro growth of hormone-dependent human breast cancer cells.Int J Oncol. 2007 Oct;31(4):777-84. Int J Oncol. 2007. PMID: 17786308
-
Pharmacological reactivation of mutant p53: from protein structure to the cancer patient.Oncogene. 2010 Jul 29;29(30):4245-52. doi: 10.1038/onc.2010.188. Epub 2010 May 24. Oncogene. 2010. PMID: 20498645 Review.
-
Restoring p53-dependent tumor suppression.Cancer Biol Ther. 2003 Jul-Aug;2(4 Suppl 1):S55-63. Cancer Biol Ther. 2003. PMID: 14508081 Review.
Cited by
-
Antibody targeting of phosphatidylserine for the detection and immunotherapy of cancer.Immunotargets Ther. 2018 Jan 23;7:1-14. doi: 10.2147/ITT.S134834. eCollection 2018. Immunotargets Ther. 2018. PMID: 29417044 Free PMC article. Review.
-
Understanding the prion-like behavior of mutant p53 proteins in triple-negative breast cancer pathogenesis: The current therapeutic strategies and future directions.Heliyon. 2024 Feb 10;10(4):e26260. doi: 10.1016/j.heliyon.2024.e26260. eCollection 2024 Feb 29. Heliyon. 2024. PMID: 38390040 Free PMC article. Review.
-
Cholesterol biosynthesis inhibitor RO 48-8071 suppresses growth of hormone-dependent and castration-resistant prostate cancer cells.Onco Targets Ther. 2016 May 30;9:3223-32. doi: 10.2147/OTT.S105725. eCollection 2016. Onco Targets Ther. 2016. PMID: 27313468 Free PMC article.
-
The anticancer agent YC-1 suppresses progestin-stimulated VEGF in breast cancer cells and arrests breast tumor development.Int J Oncol. 2013 Jan;42(1):179-87. doi: 10.3892/ijo.2012.1675. Epub 2012 Oct 24. Int J Oncol. 2013. PMID: 23123638 Free PMC article.
-
TIMs, TAMs, and PS- antibody targeting: implications for cancer immunotherapy.Cell Commun Signal. 2020 Feb 22;18(1):29. doi: 10.1186/s12964-020-0521-5. Cell Commun Signal. 2020. PMID: 32087708 Free PMC article. Review.
References
-
- Imai K, Takaoka A. Comparing antibody and small-molecule therapies for cancer. Nat Rev Cancer. 2006;6:714–727. - PubMed
-
- Chabner BA, Roberts TG., Jr Timeline: cnmhemotherapy and the war on cancer. Nat Rev Cancer. 2005;5:65–72. - PubMed
-
- Lacroix M, Toillon RA, Leclercq G. p53 and breast cancer, an update. Endocr Relat Cancer. 2006;13:293–325. - PubMed
-
- Kumar S, Walia V, Ray M, Elble RC. p53 in breast cancer: mutation and counter measures. Front Biosci. 2007;12:4168–4178. - PubMed
-
- Rahko E, Blanco G, Soini Y, et al. A mutant TP53 gene status is associated with a poor prognosis and anthracycline-resistance in breast cancer patients. Eur J Cancer. 2003;39:447–453. - PubMed
Publication types
MeSH terms
Substances
Grants and funding
LinkOut - more resources
Full Text Sources
Other Literature Sources
Medical
Research Materials
Miscellaneous
