. 2010 Jul;67(14):2467-79.
doi: 10.1007/s00018-010-0350-6. Epub 2010 Mar 28.

Characterization of the 5-HT1A receptor of the honeybee (Apis mellifera) and involvement of serotonin in phototactic behavior

Affiliations

Characterization of the 5-HT1A receptor of the honeybee (Apis mellifera) and involvement of serotonin in phototactic behavior

Markus Thamm et al. Cell Mol Life Sci. 2010 Jul.

Abstract

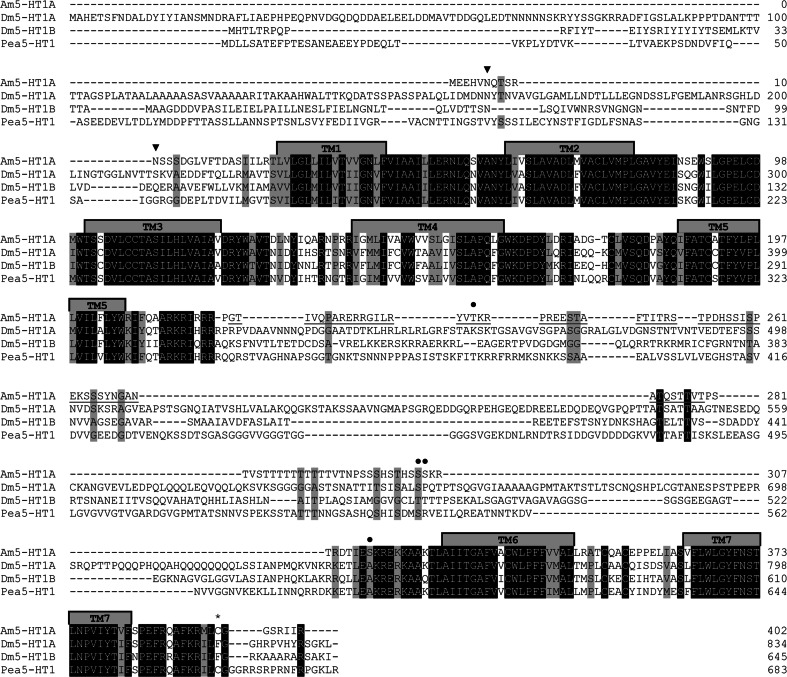
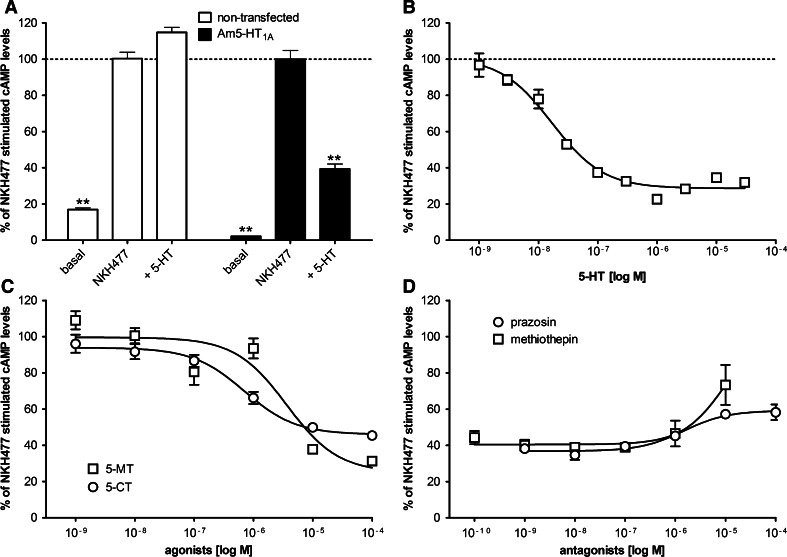
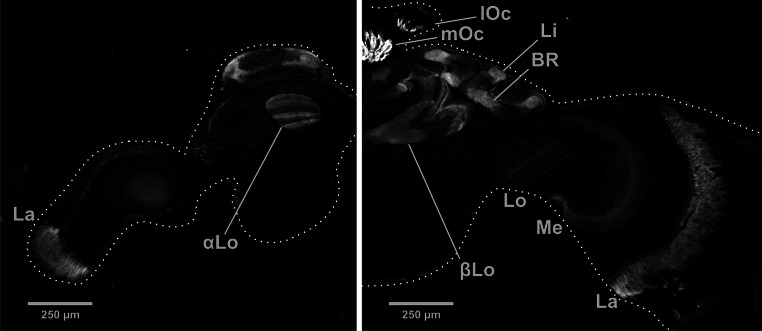
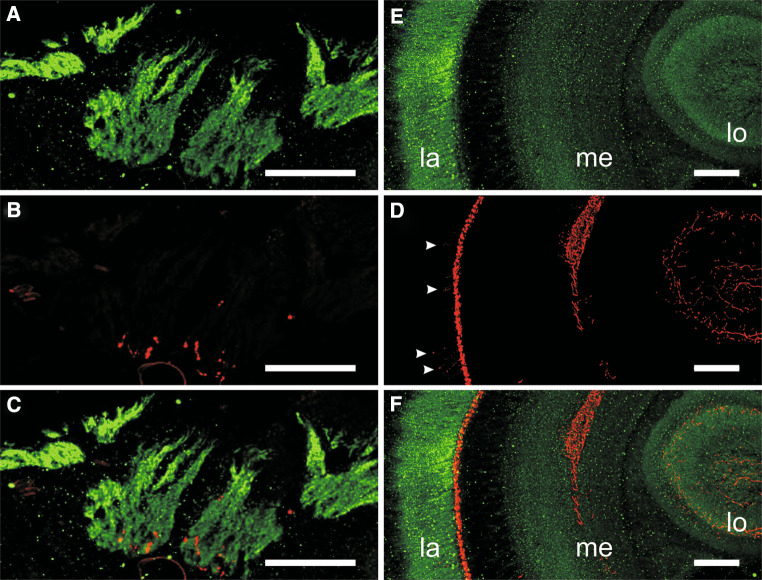
Serotonin plays a key role in modulating various physiological and behavioral processes in both protostomes and deuterostomes. The vast majority of serotonin receptors belong to the superfamily of G-protein-coupled receptors. We report the cloning of a cDNA from the honeybee (Am5-ht1A) sharing high similarity with members of the 5-HT(1) receptor class. Activation of Am5-HT(1A) by serotonin inhibited the production of cAMP in a dose-dependent manner (EC(50) = 16.9 nM). Am5-HT(1A) was highly expressed in brain regions known to be involved in visual information processing. Using in vivo pharmacology, we could demonstrate that Am5-HT(1A) receptor ligands had a strong impact on the phototactic behavior of individual bees. The data presented here mark the first comprehensive study-from gene to behavior-of a 5-HT(1A) receptor in the honeybee, paving the way for the eventual elucidation of additional roles of this receptor subtype in the physiology and behavior of this social insect.


Figures

Fig. 1
Fig. 1
Amino acid sequence alignment of Am5-HT1A and orthologous receptors from Drosophila melanogaster (Dm5-HT1A; accession no. CAA77570), Dm5-HT1B (no. CAA77571), and Periplaneta americana (Pea5-HT1, no. FN298392). Identical residues (≥80%) between the receptors are shown as white letters against black, whereas conservatively substituted residues are shaded. Putative transmembrane domains (TM1-7) are indicated by gray bars. Potential N-glycosylation sites (inverted filled triangle), phosphorylation sites via PKC (filled circle), and putative palmitoylation sites (asterisk) of Am5-HT1A are labeled. Underlined letters represent the region within the CPL3 used to raise Am5-HT1A-specific antibodies. The amino acid position is indicated on the right
Fig. 2
Fig. 2
Phylogenetic analysis of Am5-HT1A and various 5-HT receptors. Alignments were performed with BioEdit (version 7.0.5) by using the core amino acid sequences lacking the variable regions of the N- and C-terminus and the CPL3. The genetic distance was calculated with MEGA4. The receptor sequences followed by their accession numbers are listed in the order illustrated: Panulirus interruptus (Pan5-HT1, no. AY528822); Procambarus clarkii (Pro5-HT1, no. ABX10973), Penaeus monodon (Pem5-HT1, no. AAV48573), Periplaneta americana (Pea5-HT1, no. FN298392), Drosophila melanogaster (Dm5-HT1A, no. CAA77570), Dm5-HT1B (no. CAA77571), Papilio xuthus (Pxu5-HT1, no: BAD72868), Manduca sexta (Ms5-HT1A, no. DQ840515), Apis mellifera (Am5-HT1A, no. FN645449), Bombyx mori (Bm5-HT1, no. CAA64862), Ms5-HT1B (no. DQ840516), Lymnaea stagnalis (Lym5-HT1, no. L06803), human 5-HT1A (no. NP_000515), human 5-HT1B (no. NP_000854), human 5-HT1D (no. NP_000855), human 5-HT1E (no. NP_000856), human 5-HT1F (no. NP_000857), human 5-HT7 isoform a (no. NP_000863), human 5-HT7 isoform d (no. NP_062873), human 5-HT7 isoform b (no. NP_062874), Apis mellifera (Am5-HT7, no. AM076717), Dm5-HT7 (no. A38271), Aedes aegypti (Aae5-HT7, no. AAG49292), Pan5-HT2 (no. AY550910), Pro5-HT2 (no. ABX10972), Dm5-HT2 (no. CAA57429), Lym5-HT2 (no. U50080), human 5-HT2B (no. NP_000858), human 5-HT2A (no. NP_000612), human 5-HT2C (no. NP_000859), D. melanogaster ninaE-encoded rhodopsin 1 (DmninaE, no. NM_079683), and D. melanogaster FMRFamide receptor (DmFR, no. AAF47700). The numbers at the nodes of the branches represent the percentage bootstrap support for each branch. The scale bar allows conversion of branch lengths in the dendrogram to genetic distance between clades
Fig. 3
Fig. 3
Expression of Am5-HT1A in HEK 293 cells. a Western blot of membrane proteins (10 μg per lane) from HEK 293 cells treated without (−) or with (+) PNGase F. Blots were incubated with anti-HA-antibody (left) and anti-Am5-HT1A-antibody (right). Deglycosylation resulted in a shift of the protein band from ~80 to ~44 kDa. b Immunocytochemical analysis of Am5-HT1A-expressing HEK 293 cells. Cells were incubated with anti-HA-antibody. c Immunocytochemical analysis of Am5-HT1A-expressing HEK 293 cells. Cells were incubated with anti-Am5-HT1A antibody
Fig. 4
Fig. 4
Modulation of intracellular cAMP levels in HEK 293 cells constitutively expressing the Am5-HT1A receptor and in non-transfected cells. The amount of cAMP is given as the percentage of the value obtained with 10 μM NKH 477 (100%), a water-soluble forskolin analog. Error bars indicate SEM and are, in some cases, too small to be seen. The statistical analysis is based on a one-way ANOVA followed by Dunnett’s multiple comparison test; **P < 0.01. a Effect of NKH 477 and 5-HT (10 μM) on cAMP levels in non-transfected cells and in Am5-HT1A-expressing cells. To determine the basal [cAMP]i, cells were incubated with 100 μM IBMX only (basal). Data represent the mean ± SEM of four values. Asterisks indicate statistically significant differences for drug versus NKH 477 (100%) for a given cell line. b Dose-dependent effect of 5-HT (10−9 to 3 × 10−5 M) on [cAMP]i. Data represent the mean ± SEM of four values. c Dose-dependent effects of Am5-HT1A receptor agonists (10−9 to 10−4 M) on NKH 477-stimulated cAMP production in Am5-HT1A-expressing cells. Data represent the mean ± SEM of four values. d Dose-dependent effects of Am5-HT1A receptor agonists (10−10 to 10−4 M) on 5-HT-mediated (500 nM) inhibition of NKH 477-stimulated cAMP production in Am5-HT1A-expressing cells. Data represent the mean ± SEM of four values
Fig. 5
Fig. 5
a Western blot analysis with the anti-Am5-HT1A-antibody. The specificity of the anti-Am5-HT1A-antibody was tested on A. mellifera brain proteins. The anti-Am5-HT1A-antibody (1:1,000) recognized a single band of ~50 kDa on Western blots (+). Western blot analysis with anti-Am5-HT1A-antibody (1:20,000) pre-absorbed with 15 μg/ml of the peptide used for immunization resulted in no detectable bands (−). b Schematic drawing showing various regions of the honeybee brain. c Western blot analysis of membrane proteins (5 μg per lane) from various regions of the honeybee brain. Expression of Am5-HT1A could be detected in samples from central brain (cb), antennal lobes (al), optic lobes (ol), subesophageal ganglion (seg) and ventral nerve cord (vnc)
Fig. 6
Fig. 6
Immunohistochemical analysis of brain sections with the anti-Am5-HT1A-antibody. Frontal sections of anterior (a) and posterior (b) regions of the honeybee brain are shown. Specific labeling is seen in the basal ring (br), lip (li), peduncule (pd), and α- and β-lobes of the mushroom bodies. Further labeling was found in the lobula (lo), medulla (me), and lamina (la) of the optic lobes and in the median (moc) and lateral ocellar (loc) tract. Scale bar 250 μm
Fig. 7
Fig. 7
Immunohistochemical analyses of brain sections with the anti-Am5-HT1A-antibody (a, e) and an antibody against serotonin (b, d). c, f The composite images. Details of the ocellar tracts (ac) and the optic lobes (ef) are shown. For further explanation, see text. Scale bar 100 μm. lo lobula, me medulla, la lamina
Fig. 8
Fig. 8
Examples of walking paths of bees in the dark (a, e) and at illumination with light sources of lowest intensity (bd, fh). The upper panel shows the walking paths of a control bee fed with 50% sucrose. The lower panel shows the walking paths of a bee treated with 5-HT. The position of the light source is indicated by an asterisk. b, f Display the walking path of the first run to light of a specific intensity (red). c/g and d/h Display the walking paths of the second and the third runs to a light source of the same intensity (red). In c, g, d, and h the previous runs are displayed in yellow
Fig. 9
Fig. 9
a, c, e Mean walking times of bees fed with sucrose (“control”) or bees fed with various ligands of the 5-HT receptor toward three light sources of increasing intensity. The means of four runs ± SD are shown. b, d, f Mean lengths (±SD) of walking paths in the dark before illumination of the arena of controls and groups fed with various Am5-HT1A receptor ligands. Significant differences between groups are shown by asterisks (*P ≤ 0.05; **P ≤ 0.01, one-way ANOVA followed by Tukey’s multiple comparison test). The number of bees tested is given in brackets

Similar articles

Cited by

References

    1. Weiger WA. Serotonergic modulation of behaviour: a phylogenetic overview. Biol Rev Camb Philos Soc. 1997;72:61–95. doi: 10.1017/S0006323196004975. - DOI - PubMed
    1. Jones BJ, Blackburn TP. The medical benefit of 5-HT research. Pharmacol Biochem Behav. 2002;71:555–568. doi: 10.1016/S0091-3057(01)00745-6. - DOI - PubMed
    1. Walz B, Baumann O, Krach C, Baumann A, Blenau W. The aminergic control of cockroach salivary glands. Arch Insect Biochem Physiol. 2006;62:141–152. doi: 10.1002/arch.20128. - DOI - PubMed
    1. Colas JF, Launay JM, Kellermann O, Rosay P, Maroteaux L. Drosophila 5-HT2 serotonin receptor: coexpression with fushi-tarazu during segmentation. Proc Natl Acad Sci USA. 1995;92:5441–5445. doi: 10.1073/pnas.92.12.5441. - DOI - PMC - PubMed
    1. Yuan Q, Lin F, Zheng X, Sehgal A. Serotonin modulates circadian entrainment in Drosophila . Neuron. 2005;47:115–127. doi: 10.1016/j.neuron.2005.05.027. - DOI - PubMed

Publication types

MeSH terms

LinkOut - more resources