. 2010 Mar;16(1):45-59.
doi: 10.1037/a0018373.

Visualizing 3D objects from 2D cross sectional images displayed in-situ versus ex-situ

Affiliations

Visualizing 3D objects from 2D cross sectional images displayed in-situ versus ex-situ

Bing Wu et al. J Exp Psychol Appl. 2010 Mar.

Abstract

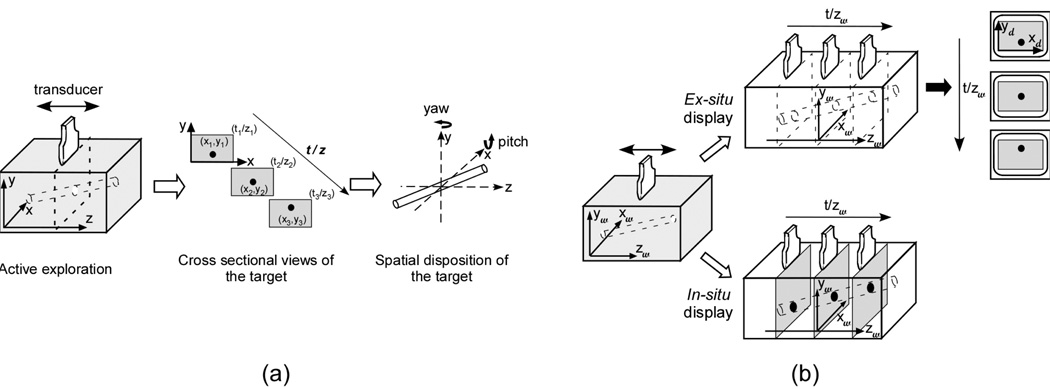
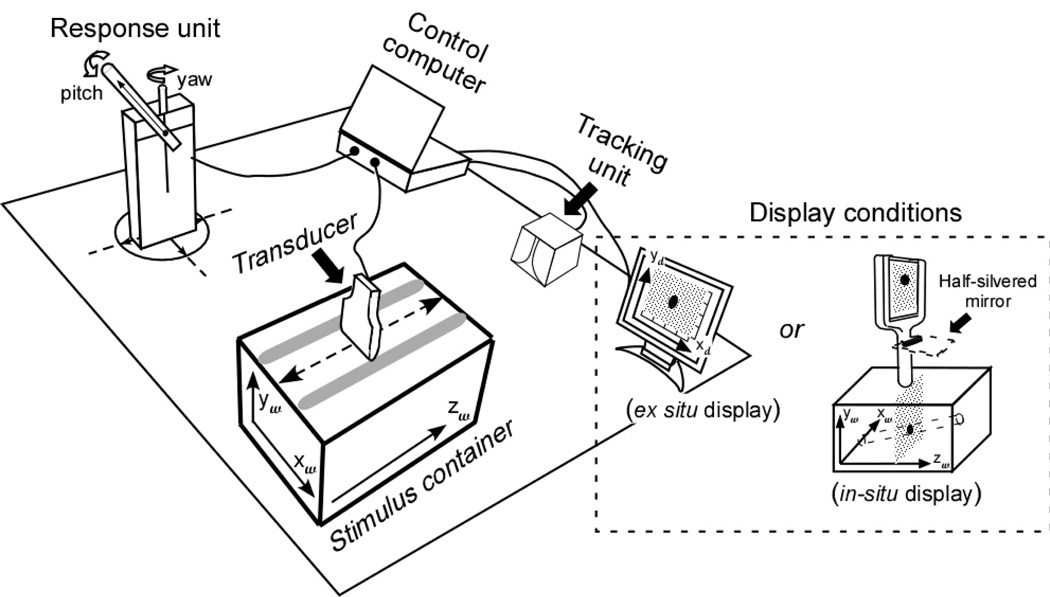
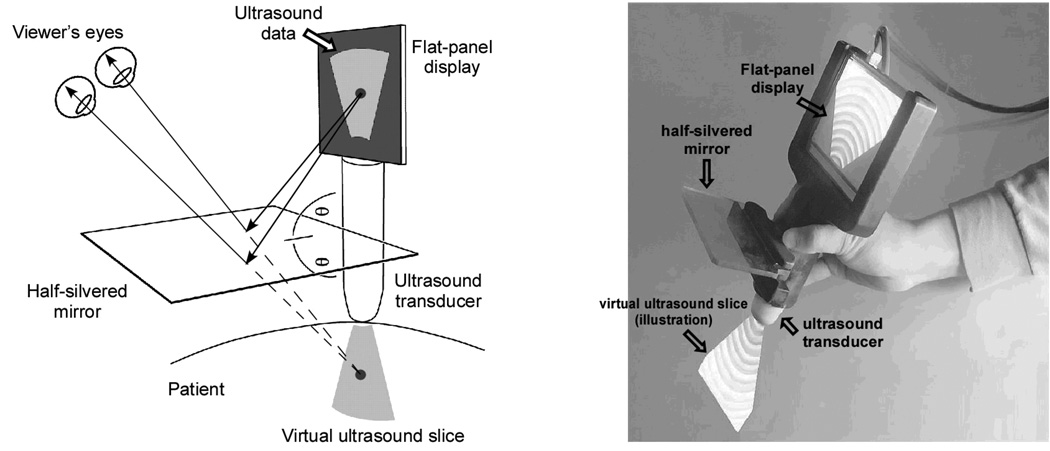
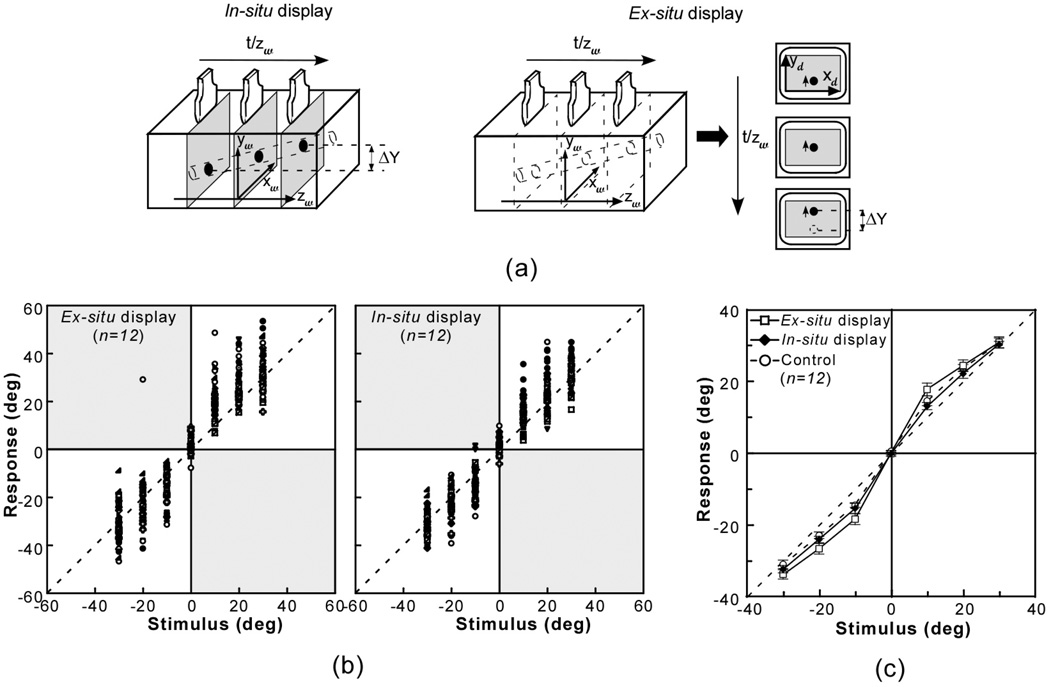
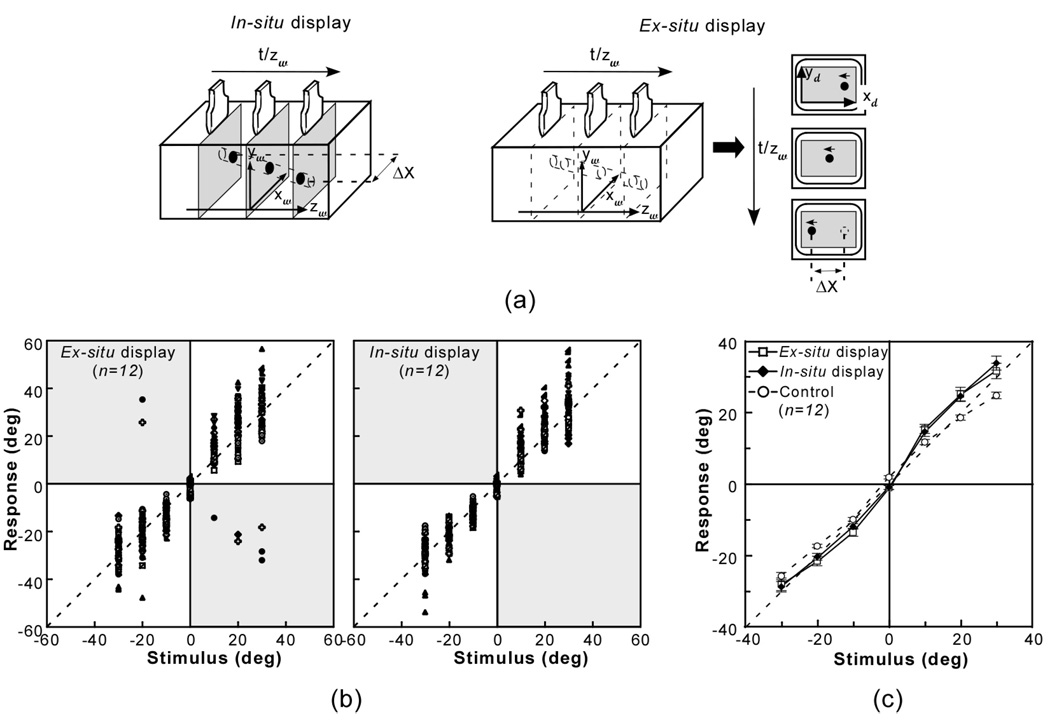
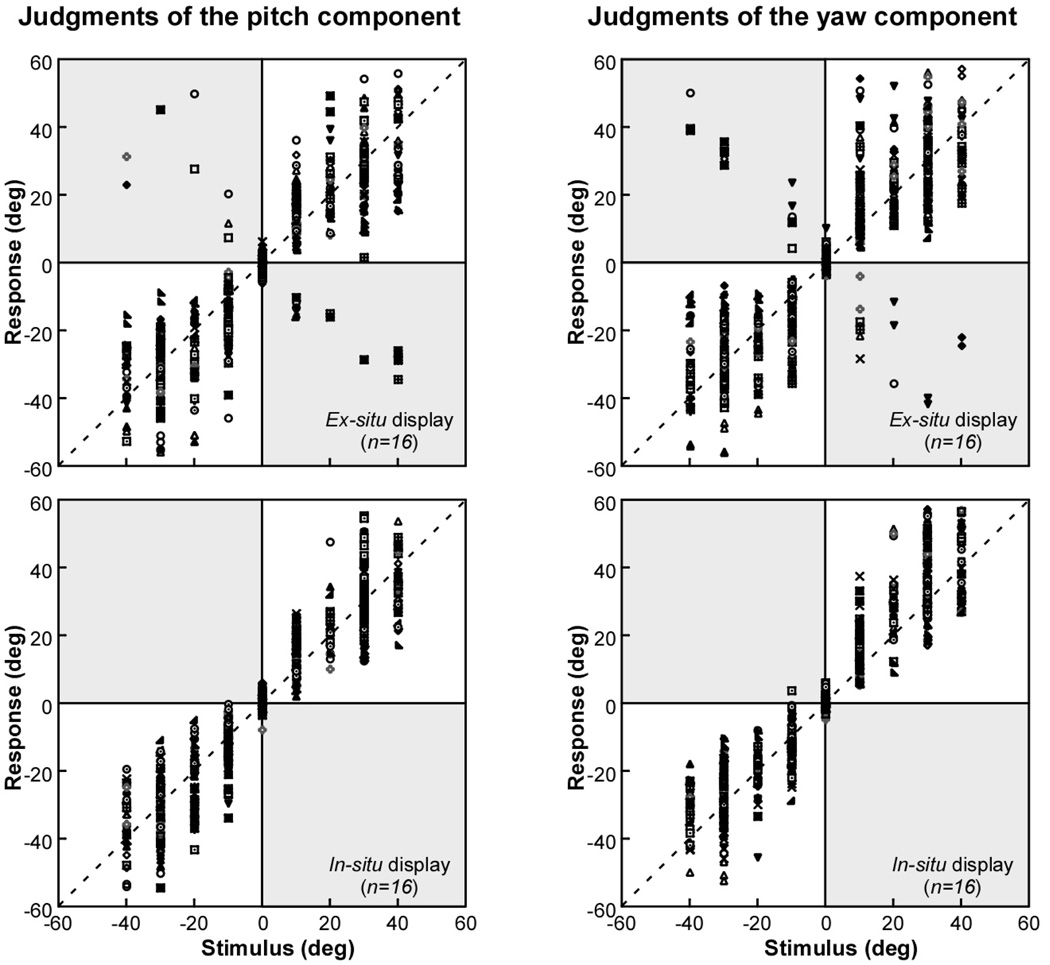
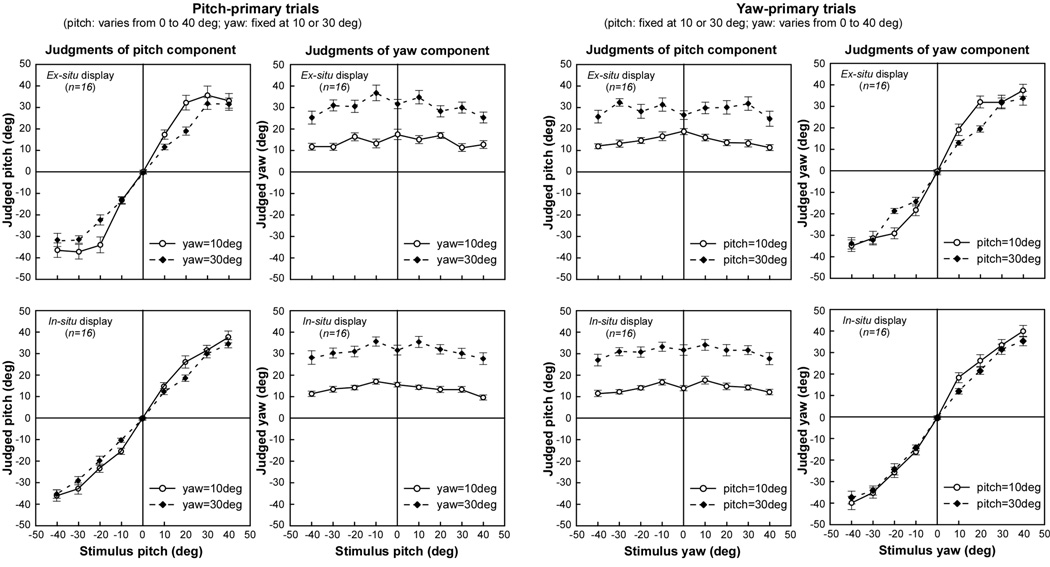
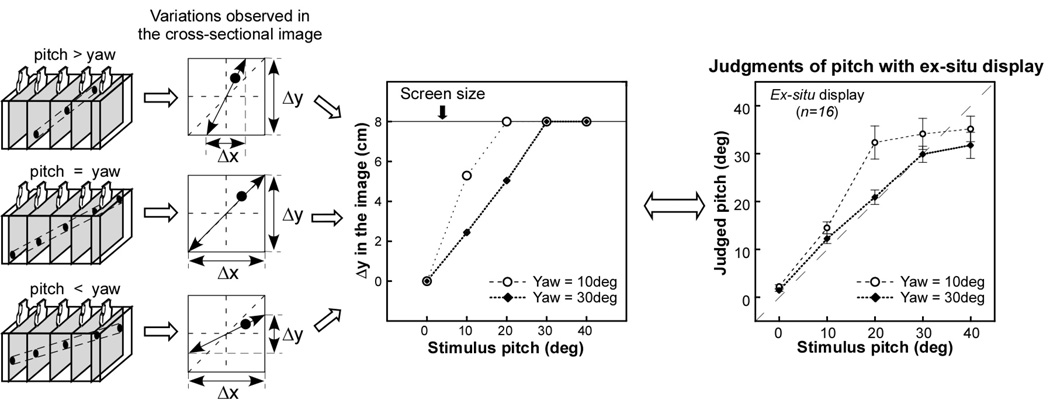
The present research investigates how mental visualization of a 3D object from 2D cross sectional images is influenced by displacing the images from the source object, as is customary in medical imaging. Three experiments were conducted to assess people's ability to integrate spatial information over a series of cross sectional images in order to visualize an object posed in 3D space. Participants used a hand-held tool to reveal a virtual rod as a sequence of cross-sectional images, which were displayed either directly in the space of exploration (in-situ) or displaced to a remote screen (ex-situ). They manipulated a response stylus to match the virtual rod's pitch (vertical slant), yaw (horizontal slant), or both. Consistent with the hypothesis that spatial colocation of image and source object facilitates mental visualization, we found that although single dimensions of slant were judged accurately with both displays, judging pitch and yaw simultaneously produced differences in systematic error between in-situ and ex-situ displays. Ex-situ imaging also exhibited errors such that the magnitude of the response was approximately correct but the direction was reversed. Regression analysis indicated that the in-situ judgments were primarily based on spatiotemporal visualization, while the ex-situ judgments relied on an ad hoc, screen-based heuristic. These findings suggest that in-situ displays may be useful in clinical practice by reducing error and facilitating the ability of radiologists to visualize 3D anatomy from cross sectional images.


Figures

Figure 1
Figure 1
(a) Illustration of the experimental task. Participants were asked to explore a hidden, virtual rod with a hand-held device, exposing it over time as a sequence of cross sectional images traced out along the z axis, and then to report its slant. (b) Example of the stimulus event presented to the participant when exploring a target rod in the in-situ and ex-situ viewing conditions. In the ex-situ viewing condition (top), the cross sectional image was shown on a remote monitor. With in-situ viewing (bottom), the rod’s cross section was seen at its actual location in the space of exploration. The subscripts “w” and “d” denote world and display coordinates, respectively.
Figure 2
Figure 2
Schematic of the experimental setup. Participants used a transducer to scan a target rod that was hidden inside the stimulus container, exposing it as a sequence of cross sectional images. Their judgments of the rod’s orientation were measured by making a response rod parallel to it. Two types of display (in-situ vs. ex-situ) were tested. The subscripts “w” and “d” denote world and display coordinates, respectively.
Figure 3
Figure 3
Schematic and photograph of the augmented-reality visualization device. Through the half-silvered mirror, the ultrasound image is projected as if it “shines out” from the transducer and illuminates the inner structures (from Wu, Klatzky, Shelton, & Stetten, 2005, with permission, © 2005 IEEE).
Figure 4
Figure 4
Experiment 1: Judging the pitch-slant of a virtual rod. (a) The stimulus cues. The rod’s pitch orientation could be estimated from the displacement of its cross section in the vertical dimension (Δy) with respect to the transducer movement (Δz). (b) Scatter plot of individual participant responses as a function of stimulus angle. Different symbols represent responses by individual subjects. Reversal responses, if present, appear as points in the shaded quadrants. (c) Mean judged orientation as a function of stimulus angle using the in-situ and ex-situ displays. Error bars represent the standard error of the mean.
Figure 5
Figure 5
Experiment 2: Judging the yaw-slant of a virtual rod. (a) The rod’s yaw orientation can be estimated from the horizontal displacement of its cross section (Δx) corresponding to the transducer movement (Δz). (b) Scatter plot of individual participant responses as a function of stimulus angle. Different symbols represent responses by individual subjects. Reversal responses, if present, appear as points in the shaded quadrants. (c) Mean response as a function of stimulus angle. Error bars represent the standard error of the mean.
Figure 6
Figure 6
Experiment 3: Judging yaw and pitch simultaneously. Scatter plot of the participants’ judgments of pitch and yaw with ex-situ and in-situ displays, showing response angle as a function of stimulus angle. Different symbols represent responses by individual subjects. Reversal responses, if present, appear as points in the shaded quadrants.
Figure 7
Figure 7
Mean judged pitch and yaw as a function of the objective primary-stimulus orientation using ex-situ (top row) and in-situ (bottom row) displays. The left and right panels show respectively the results obtained from the Pitch-primary and Yaw-primary trials. The open and filled symbols correspond to judgments of the variable orientation (pitch or yaw), when the other orientation (yaw or pitch) was fixed at 10° and 30°, respectively. Error bars represent the standard error of the mean.
Figure 8
Figure 8
(Left) Illustration of how the value of pitch relative to yaw changes the maximal screen variation in the horizontal (Δx) and vertical (Δy) position of the rod cross section; (Middle) Maximal vertical screen variation as a function of the objective value of pitch, given the two values of yaw tested in Experiment 3 (note that the analogous relation obtains when the roles of pitch and yaw are reversed); (Right) Judged value of pitch in the ex-situ condition as a function of the objective value, given fixed values of yaw (re-plotted using the same data shown in Figure 7 as a function of amplitude of pitch-slant). Note the similarity of the data (right) to the maximum screen variation (middle).

References

    1. Amesur N, Wang D, Chang W, Weiser D, Klatzky R, Shukla G, Stetten G. Peripherally Inserted Central Catheter Placement by Experienced Interventional Radiologist using the Sonic Flashlight. Journal of Vascular and Interventional Radiology. in press. - PMC - PubMed
    1. Anstis S. Local and global segmentation of rotating shapes viewed through multiple slits. Journal of Vision. 2005;5:194–201. - PubMed
    1. Anstis S, Atkinson J. Distortions in moving figures viewed through a stationary slit. American Journal of Psychology. 1967;80:572–785. - PubMed
    1. Barratt ES. An analysis of verbal reports of solving spatial problems as aid in defining spatial factors. The Journal of Psychology. 1953;36:17–25.
    1. Braunstein ML, Payne JW. Perspective and form ratio as determinants of relative slant judgments. Journal of Experimental Psychology. 1969;81:584–590.

Publication types