. 2010 Aug 1;52(1):224-33.
doi: 10.1016/j.neuroimage.2010.03.064. Epub 2010 Mar 27.

Frequency-dependent neural activity, CBF, and BOLD fMRI to somatosensory stimuli in isoflurane-anesthetized rats

Affiliations

Frequency-dependent neural activity, CBF, and BOLD fMRI to somatosensory stimuli in isoflurane-anesthetized rats

Tae Kim et al. Neuroimage. .

Abstract

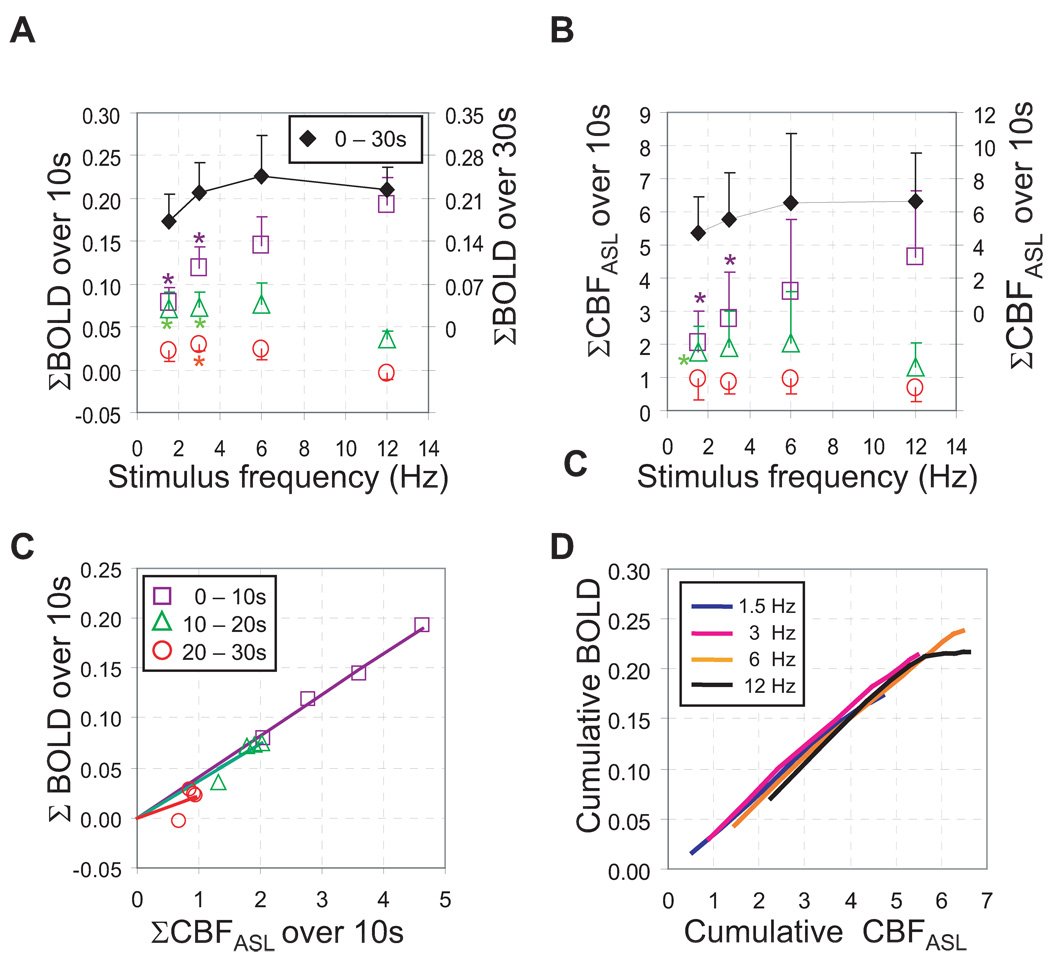
Inhalation anesthetics (e.g. isoflurane) are preferable for longitudinal fMRI experiments in the same animals. We previously implemented isoflurane anesthesia for rodent forepaw stimulation studies, and optimized the stimulus parameters with short stimuli (1-3-s long stimulation with ten electric pulses). These parameters, however, may not be applicable for long periods of stimulation because repetitive stimuli induce neural adaptation. Here we evaluated frequency-dependent responses (pulse width of 1.0 ms and current of 1.5 mA) for 30-s long stimulation under 1.3-1.5% isoflurane anesthesia. The cerebral blood flow (CBF) response (using laser Doppler flowmetry: CBF(LDF)) and field potential (FP) changes were simultaneously measured for nine stimulus frequencies (1-24 Hz). CBF (using arterial spin labeling: CBF(ASL)) and blood oxygenation level dependent (BOLD) fMRI responses were measured at 9.4 T for four stimulus frequencies (1.5-12 Hz). Higher stimulus frequencies (12-24 Hz) produced a larger FP per unit time initially, but decreased more rapidly later due to neural adaptation effects. On the other hand, lower stimulus frequencies (1-3 Hz) induced smaller, but sustained FP activities over the entire stimulus period. Similar frequency-dependencies were observed in CBF(LDF), CBF(ASL) and BOLD responses. A linear relationship between FP and CBF(LDF) was observed for all stimulus frequencies. Stimulation frequency for the maximal cumulative neural and hemodynamic changes is dependent on stimulus duration; 8-12 Hz for short stimulus durations (<10s) and 6-8 Hz for 30-s stimulation. Our findings suggest that neural adaptation should be considered in determining the somatosensory stimulation frequency and duration under isoflurane anesthesia.


Figures

Fig. 1
Fig. 1
Averaged temporal profiles of evoked FP and CBFLDF responses (n = 6 animals). (A) FP amplitude time courses for four stimulus frequencies which were used in the fMRI studies. Each data point indicates the mean of the 6 animal studies for each individual stimulus pulse. The inserted plot shows the initial 2-s of data; the neural activity reached a pseudo-steady state within one second after simulation onset. (B) bin-FP per 2-s unit-time was calculated to take into account of the different number of stimulus pulses over a given period. The bin-FP amplitude for higher frequency stimuli was initially larger, but decreased more quickly over time, while the bin-FP amplitude for lower frequency stimuli was relatively maintained over the entire period of stimulation. (C) Frequency-dependent CBF responses measured by LDF. Similar trends as FP responses were observed. Error bar: SD every 2 s.
Fig. 2
Fig. 2
Summation of FP change (A) and the area under CBFLDF curve (B) over 10 s (left axis) and 30 s (right axis) as a function of stimulus frequency (n = 6 animals). To examine frequency-dependence in the FP and CBF responses over different stimulus periods, signal changes were compared over three stimulus period of 0 – 10 s (open squares), 10 – 20 s (open triangles) and 20 – 30 s (open circles). Data for 0 – 30 s are summation of these three stimulation periods (closed diamonds). Statistically significant differences between the responses at 12 Hz vs. other frequencies were obtained (*p < 0.05). Error bars: SEM. (C) ΣFP and ΣCBF changes over 10-s periods were compared. (D) The relationship between the cumulative FP and the cumulative integral of the CBFLDF response for all stimulation frequencies are shown (mean R of four frequencies = 0.998). These high correlations indicate that the hemodynamic responses are highly coupled with the neural responses. The neurovascular relationship was independent of stimulation frequencies and durations.
Fig. 3
Fig. 3
The averaged BOLD (A) and CBFASL fMRI (B) time courses (n = 6 animals) for four different frequencies, obtained from the 16-pixel contralateral somatosensory cortex ROI. The green box in the inserted image shows the ROI (A). The BOLD and CBFASL responses were highly correlated in all frequencies (R > 0.95). The largest peak response was detected at 12 Hz stimulus frequency but this elevated response was quickly declined. However, at lower frequencies, the elevated signals were maintained during the entire stimulation period. The three color bars underneath the time courses indicate the time periods for the generation of functional maps shown in Fig. 4. FWHM and TTP (C), and peak amplitude (D) of time courses were measured. FWHM and TTP were decreased with stimulus frequency, while peak amplitude was increased with stimulus frequency. Statistically significant differences between the responses at 12 Hz vs. other frequencies were obtained (*p < 0.05, ** p< 0.01). Error bars: SD
Fig. 4
Fig. 4
Frequency-dependent fMRI results. fMRI t-value maps were generated from images acquired during baseline vs. three stimulus periods for the different frequencies. BOLD fMRI maps (A) were overlaid on T1-weighted images, while CBFASL fMRI maps (B) were overlaid on quantified baseline CBF maps in units of ml/ g/ min from one animal (grayscale bar indicates quantified CBF value). The 30-s stimulation data were divided into three stimulus periods: 0 – 10 s, 10 – 20 s, and 20 – 30 s after stimulation onset. In addition, the GLM analysis was performed with a gamma function obtained for each frequency. Each color of box represents the stimulus period bar shown in Fig 3. The number of activated pixels with a t-value ≥ 3 in the contralateral hemisphere was determined. The area of activation decreased with later stimulus periods at 12-Hz frequency, while it was relatively maintained over entire stimulus periods at lower stimulus frequencies. However, fMRI maps from the GLM analysis (black color boxes in Fig, A and B) yields a similar number of activated pixels (black color bars in Fig, C and D) over different stimulus frequencies. The average number of activated pixels (n = 6 animals) is plotted for BOLD (C) and CBFASL (D). Statistical comparisons were performed between the 0 – 10 s and 10 – 20 s stimulus period, between 10 – 20 s and 20 – 30 s stimulus period, and between GLM data across each stimulus frequency (paired student t-test, *p < 0.05, ** p < 0.01). Color-scale bars: t-value; error bars: SEM.
Fig. 5
Fig. 5
The area under the BOLD (A) and CBFASL (B) signal changes is plotted as a function of stimulus frequency. The signal changes were calculated over three stimulus periods (scales at left axis) of 0 – 10 s (open squares), 10 – 20 s (open triangles) and 20 – 30 s (open circles). Closed black diamond symbols (scales at right axis) present the summation of three stimulus durations (0 – 30 s). The largest signal changes appeared to be 12 Hz for 0 – 10 s stimulus period, but significantly decreased for the later stimulus period. Statistical differences between the responses at 12 Hz vs. other frequencies were obtained (*p < 0.05). Error bars: SD (N = 6 animals). (C) ΣCBFASL and ΣBOLD changes over 10-s periods were compared. (D) Cumulative responses of BOLD and CBFASL were highly correlated in each stimulus frequency, showing their tight coupling.

References

    1. Alkire MT, Hudetz AG, Tononi G. Consciousness and anesthesia. Science. 2008;322:876–880. - PMC - PubMed
    1. Banoub M, Tetzlaff JE, Schubert A. Pharmacologic and physiologic influences affecting sensory evoked potentials: implications for perioperative monitoring. Anesthesiology. 2003;99:716–737. - PubMed
    1. Barbier EL, Silva AC, Kim HJ, Williams DS, Koretsky AP. Perfusion analysis using dynamic arterial spin labeling (DASL) Magn Reson Med. 1999;41:299–308. - PubMed
    1. Bock C, Krep H, Brinker G, Hoehn-Berlage M. Brainmapping of alpha-chloralose anesthetized rats with T2*-weighted imaging: distinction between the representation of the forepaw and hindpaw in the somatosensory cortex. NMR Biomed. 1998;11:115–119. - PubMed
    1. Brinker G, Bock C, Busch E, Krep H, Hossmann KA, Hoehn-Berlage M. Simultaneous recording of evoked potentials and T2*-weighted MR images during somatosensory stimulation of rat. Magn Reson Med. 1999;41:469–473. - PubMed

Publication types

MeSH terms

LinkOut - more resources