

Vascular contributions to pattern analysis: comparing gradient and spin echo fMRI at 3T
- PMID: 20350605
- PMCID: PMC3084461
- DOI: 10.1016/j.neuroimage.2010.03.061
Vascular contributions to pattern analysis: comparing gradient and spin echo fMRI at 3T
Abstract
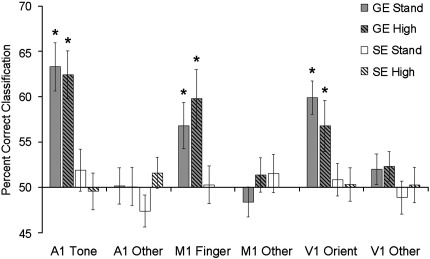
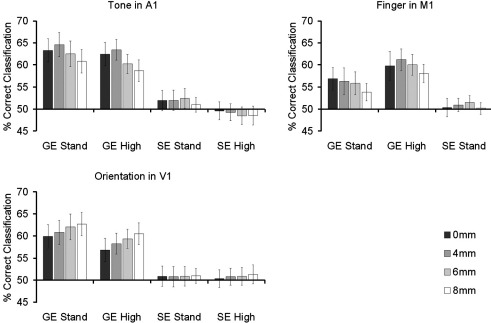
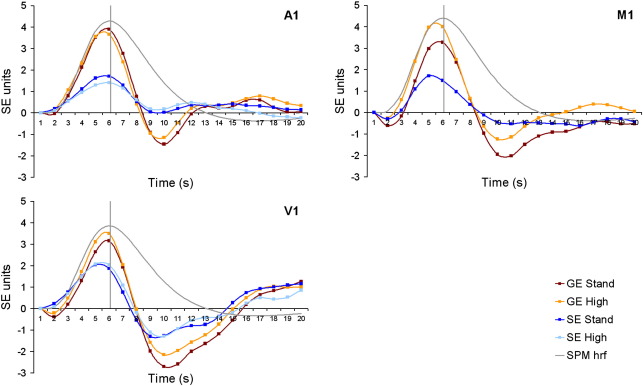
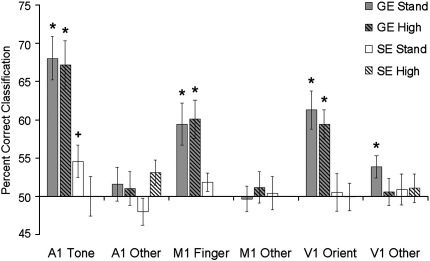
Multivariate pattern analysis is often assumed to rely on signals that directly reflect differences in the distribution of particular neural populations. The source of the signal used in these analyses remains unclear however, and an alternative model suggests that signal from larger draining veins may play a significant role. The current study was designed to investigate the vascular contribution to pattern analyses at 3T by comparing the results obtained from gradient and spin echo data. Classification analyses were carried out comparing line orientations in V1, tone frequencies in A1, and responses from different fingers in M1. In all cases, classification accuracy in the spin echo data was not significantly different from chance. In contrast, classification accuracies in the gradient echo data were significantly above chance, and significantly higher than the accuracies observed for the spin echo data. These results suggest that at the field strength and spatial resolution used for the majority of fMRI studies, a considerable proportion of the signal used by pattern analysis originates in the vasculature.
Copyright © 2010 Elsevier Inc. All rights reserved.
Figures
Similar articles
-
Characterizing contrast origins and noise contribution in spin-echo EPI BOLD at 3 T.Magn Reson Imaging. 2019 Apr;57:328-336. doi: 10.1016/j.mri.2018.11.005. Epub 2018 Nov 12. Magn Reson Imaging. 2019. PMID: 30439514
-
Functional localization in the human brain: Gradient-Echo, Spin-Echo, and arterial spin-labeling fMRI compared with neuronavigated TMS.Hum Brain Mapp. 2011 Mar;32(3):341-57. doi: 10.1002/hbm.21024. Hum Brain Mapp. 2011. PMID: 20533563 Free PMC article.
-
Diffusion-weighted spin-echo fMRI at 9.4 T: microvascular/tissue contribution to BOLD signal changes.Magn Reson Med. 1999 Nov;42(5):919-28. doi: 10.1002/(sici)1522-2594(199911)42:5<919::aid-mrm12>3.0.co;2-8. Magn Reson Med. 1999. PMID: 10542351
-
Spin-echo fMRI: The poor relation?Neuroimage. 2012 Aug 15;62(2):1109-15. doi: 10.1016/j.neuroimage.2012.01.003. Epub 2012 Jan 8. Neuroimage. 2012. PMID: 22245351 Review.
-
Biophysical and physiological origins of blood oxygenation level-dependent fMRI signals.J Cereb Blood Flow Metab. 2012 Jul;32(7):1188-206. doi: 10.1038/jcbfm.2012.23. Epub 2012 Mar 7. J Cereb Blood Flow Metab. 2012. PMID: 22395207 Free PMC article. Review.
Cited by
-
Noise differentially impacts phoneme representations in the auditory and speech motor systems.Proc Natl Acad Sci U S A. 2014 May 13;111(19):7126-31. doi: 10.1073/pnas.1318738111. Epub 2014 Apr 28. Proc Natl Acad Sci U S A. 2014. PMID: 24778251 Free PMC article.
-
Attentional modulation of fMRI responses in human V1 is consistent with distinct spatial maps for chromatically defined orientation and contrast.J Neurosci. 2011 Sep 7;31(36):12900-5. doi: 10.1523/JNEUROSCI.0580-11.2011. J Neurosci. 2011. PMID: 21900568 Free PMC article.
-
The relationship between working memory storage and elevated activity as measured with functional magnetic resonance imaging.J Neurosci. 2012 Sep 19;32(38):12990-8. doi: 10.1523/JNEUROSCI.1892-12.2012. J Neurosci. 2012. PMID: 22993416 Free PMC article.
-
Stimulus-specific suppression preserves information in auditory short-term memory.Proc Natl Acad Sci U S A. 2011 Aug 2;108(31):12961-6. doi: 10.1073/pnas.1102118108. Epub 2011 Jul 18. Proc Natl Acad Sci U S A. 2011. PMID: 21768383 Free PMC article. Clinical Trial.
-
Spin-Echo Resting-State Functional Connectivity in High-Susceptibility Regions: Accuracy, Reliability, and the Impact of Physiological Noise.Brain Connect. 2016 May;6(4):283-97. doi: 10.1089/brain.2015.0365. Epub 2016 Mar 23. Brain Connect. 2016. PMID: 26842962 Free PMC article.
References
-
- Bandettini P.A., Wong E.C., Jesmanowicz A., Hinks R.S., Hyde J.S. Proceedings of the 12th Meeting of the Society of Magnetic Resonance in Medicine. 1993. Simultaneous mapping of activation induced ΔR2* and ΔR2 in the human brain using a combined gradient-echo and spin-echo EPI pulse sequence. New York.
-
- Boynton G.M. Imaging orientation selectivity: decoding conscious perception in V1. Nature Neuroscience. 2005;8:541–542. - PubMed
-
- Brett M., Anton J.L., Valabregue R., Poline J.B. 8th International Conference on Functional Mapping of the Human Brai. 2002. Region of interest analysis using an SPM toolbox. Sendai, Japan.
-
- Chawla D., Rees G., Friston K.J. The physiological basis of attentional modulation in extrastriate visual areas. Nature Neuroscience. 1999;2:671–676. - PubMed
Publication types
MeSH terms
Grants and funding
LinkOut - more resources
Full Text Sources
Medical
