. 2010 May 15;588(Pt 10):1709-17.
doi: 10.1113/jphysiol.2010.188300. Epub 2010 Mar 29.

Initiation of simple and complex spikes in cerebellar Purkinje cells

Affiliations

Initiation of simple and complex spikes in cerebellar Purkinje cells

Lucy M Palmer et al. J Physiol. .

Abstract

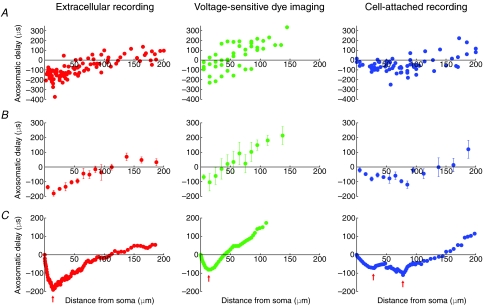
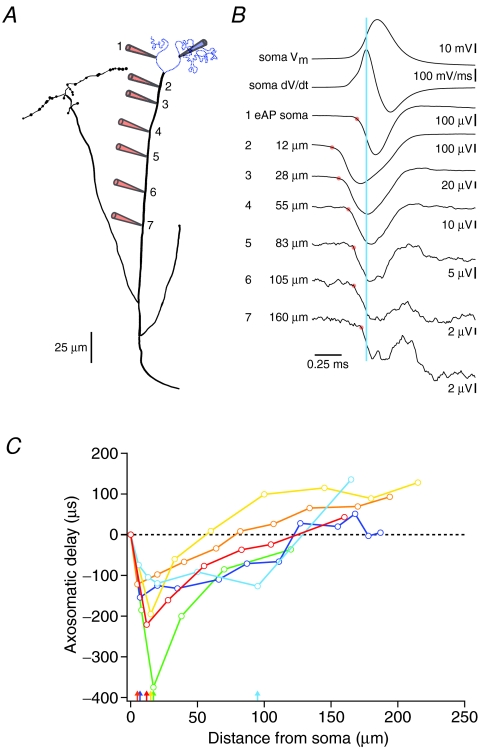
Cerebellar Purkinje cells produce two distinct forms of action potential output: simple and complex spikes. Simple spikes occur spontaneously or are driven by parallel fibre input, while complex spikes are activated by climbing fibre input. Previous studies indicate that both simple and complex spikes originate in the axon of Purkinje cells, but the precise location where they are initiated is unclear. Here we address where in the axon of cerebellar Purkinje cells simple and complex spikes are generated. Using extracellular recording and voltage-sensitive dye imaging in rat and mouse Purkinje cells, we show that both simple and complex spikes are generated in the proximal axon, 15-20 mum from the soma. Once initiated, simple and complex spikes propagate both down the axon and back into the soma. The speed of backpropagation into the soma was significantly faster for complex compared to simple spikes, presumably due to charging of the somatodendritic membrane capacitance during the climbing fibre synaptic conductance. In conclusion, we show using two independent methods that the final integration site of simple and complex spikes is in the proximal axon of cerebellar Purkinje cells, at a location corresponding to the distal end of the axon initial segment.


Figures

Figure 4
Figure 4. Voltage-sensitive dye imaging of complex spike initiation
A, image of a cerebellar Purkinje cell filled with voltage-sensitive dye. B, somatic whole-cell recording of a complex spike (top, grey) in the Purkinje cell shown in A together with corresponding axonal fluorescence responses (black) at the indicated locations detected using voltage-sensitive dye imaging. Red circles indicate the time when the first spike in the complex spike fluorescence response reaches 50% of its maximum amplitude. The fluorescence trace in the proximal axon (red; 10 μm from the hillock) slightly precedes the soma and all other axonal locations. Coloured labels correspond to the coloured boxes in A, indicating the location of regions of interest. C, axosomatic delays for the first spike in the complex spike for 6 Purkinje cells (each indicated by a separate colour; the red trace is the data shown in B) recorded at physiological (open circles) and room temperature (filled circles). Coloured arrows mark the location of the minima for each cell.
Figure 3
Figure 3. Comparison of simple spike data recorded using three different methods
A, synopsis of axosomatic delays measured using extracellular recording (left), voltage-sensitive dye imaging (middle) and cell-attached recording (right). Each data point corresponds to a single axonal location. Data points are from 17, 4 and 80 cells, respectively. B, axosomatic delays calculated by binning the data in A according to distance. Bin width was 10 μm for distances up to 100 μm and 25 μm for larger distances. Error bars indicate s.e.m. C, 10-point moving average of the data in A. Red arrows mark the location of the minima of the axosomatic delay in each population.
Figure 1
Figure 1. Extracellular action potential recording of simple spike initiation
A, Neurolucida reconstruction of the soma and axon of a Purkinje cell indicating the location of extracellular recording sites (red pipettes). B, whole-cell voltage recording of spontaneous simple spikes (top trace) and extracellular recording of simple spikes at the soma and the indicated axon locations (same cell as in A). Data aligned to the peak of the somatic dV/dt (vertical line). Red circles indicate the time when the eAP reaches 10% of its maximum amplitude. C, axosomatic delays for data shown in B (red) and for 5 other cells (each indicated by a separate colour) plotted with respect to axonal distance of the recording sites. Coloured arrows mark the location of the minima for each cell.
Figure 2
Figure 2. Voltage-sensitive dye imaging of simple spike initiation
A, image of a cerebellar Purkinje cell filled with voltage-sensitive dye. B, somatic whole-cell recording of a spontaneous simple spike (top, grey) in the cell shown in A together with corresponding axonal fluorescence responses (black) at the indicated locations detected using voltage-sensitive dye imaging. Red circles indicate the time when the response reaches 50% of its maximum amplitude. The fluorescence response in the proximal axon (20 μm from the hillock) precedes that in the soma and all other axonal locations. Coloured labels correspond to the coloured boxes in A, indicating the regions of interest. C, axosomatic delays for data shown in B (red) and 3 other cells (each indicated by a separate colour) plotted with respect to axonal distance of the recording sites. Coloured arrows mark the location of the minima for each cell.

References

    1. Antic S, Zecevic D. Optical signals from neurons with internally applied voltage-sensitive dyes. J Neurosci. 1995;15:1392–1405. - PMC - PubMed
    1. Antic S, Major G, Zecevic D. Fast optical recordings of membrane potential changes from dendrites of pyramidal neurons. J Neurophysiol. 1999;82:1615–1621. - PubMed
    1. Bekkers JM, Häusser M. Targeted dendrotomy reveals active and passive contributions of the dendritic tree to synaptic integration and neuronal output. Proc Natl Acad Sci U S A. 2007;104:11447–11452. - PMC - PubMed
    1. Clark BA, Monsivais P, Branco T, London M, Häusser M. The site of action potential initiation in cerebellar Purkinje neurons. Nat Neurosci. 2005;8:137–139. - PubMed
    1. Colbert CM, Johnston D. Axonal action-potential initiation and Na+ channel densities in the soma and axon initial segment of subicular pyramidal neurons. J Neurosci. 1996;16:6676–6686. - PMC - PubMed

Publication types