

Impaired germinal center responses and suppression of local IgG production during intracellular bacterial infection
- PMID: 20351185
- PMCID: PMC3190965
- DOI: 10.4049/jimmunol.0902710
Impaired germinal center responses and suppression of local IgG production during intracellular bacterial infection
Abstract
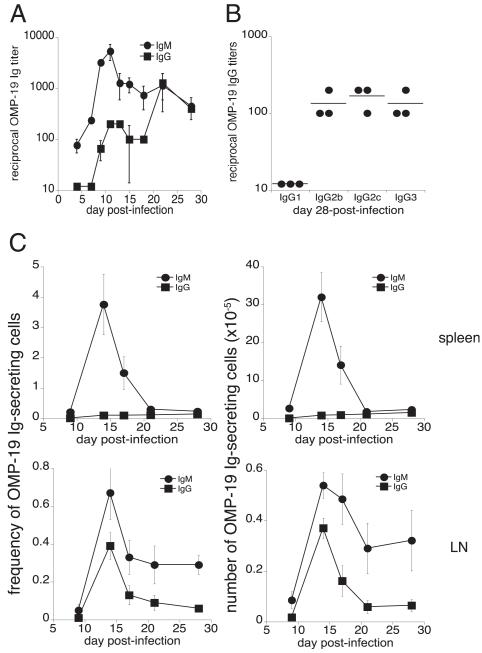
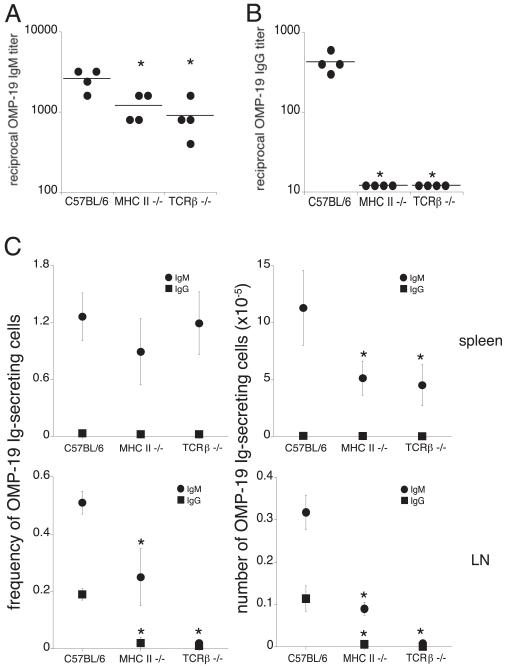
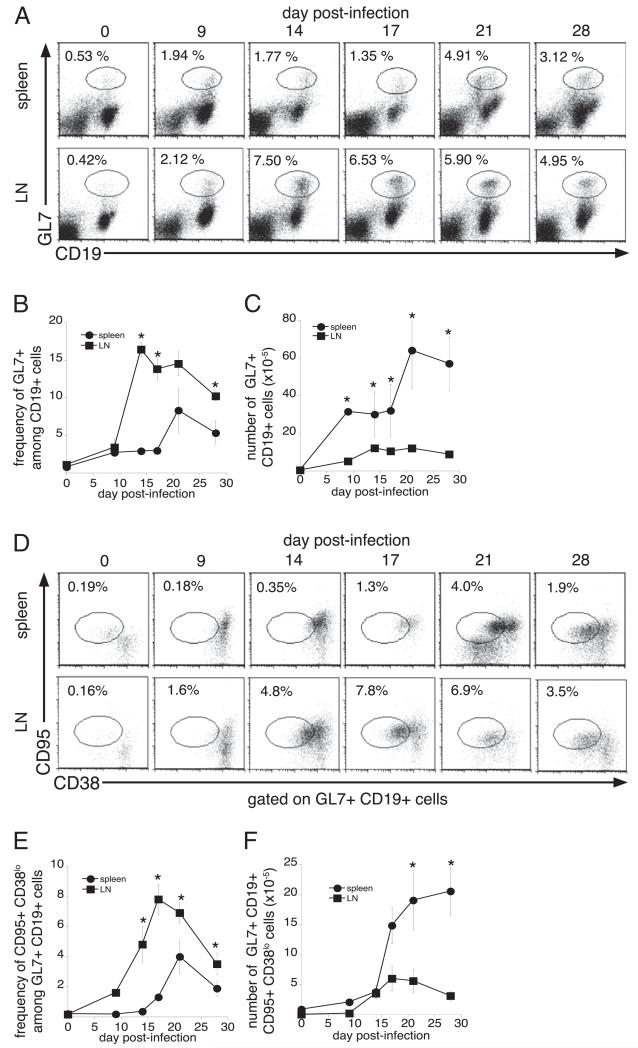
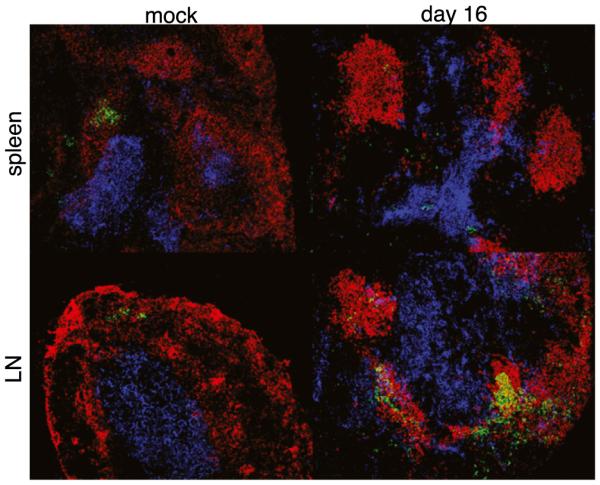
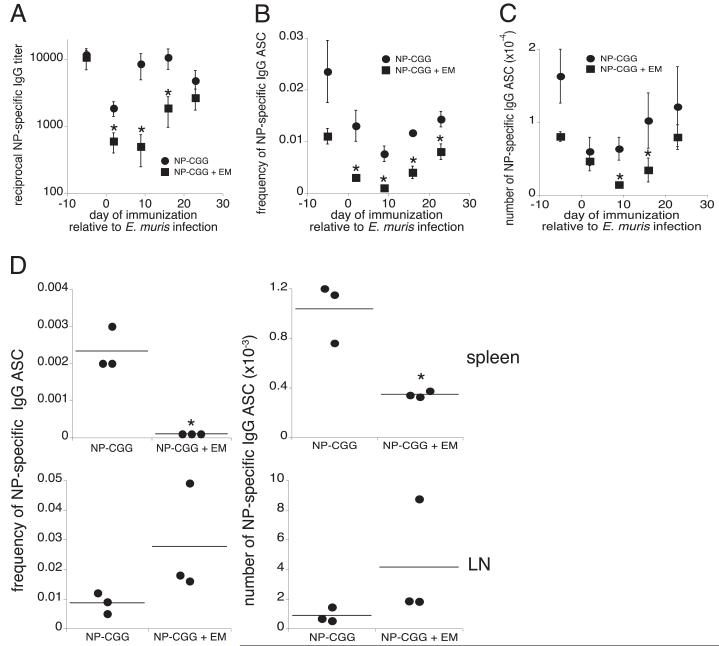
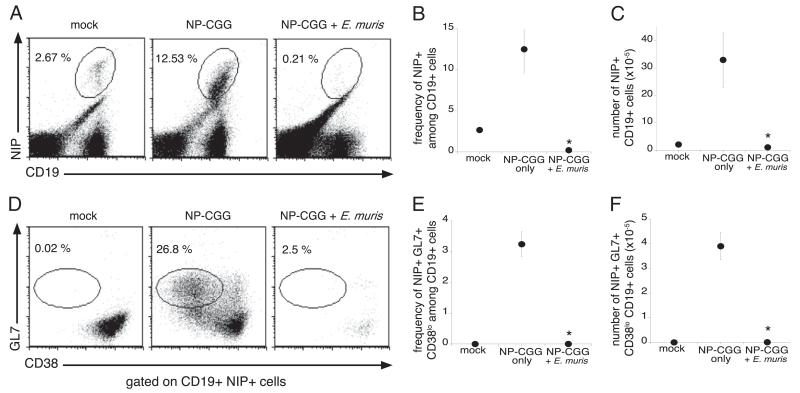
Germinal centers (GCs) are specialized microenvironments in secondary lymphoid organs that facilitate the development of high-affinity, isotype-switched Abs, and immunological memory; consequently, many infections require GC-derived IgG for pathogen clearance. Although Ehrlichia muris infection elicits a robust expansion of splenic, IgM-secreting plasmablasts, we detected only very low frequencies of isotype-switched IgG-secreting cells in mouse spleens, until at least 3 wk postinfection. Instead, Ag-specific IgG was produced in lymph nodes, where it required CD4 T cell help. Consistent with these findings, organized GCs and phenotypically defined splenic GC B cells were found in lymph nodes, but not spleens. Ehrlichial infection also inhibited spleen IgG responses against a coadministered T cell-dependent Ag, hapten 4-hydroxy-3-nitrophenyl acetyl (NP)-conjugated chicken gamma globulin in alum. NP-specific B cells failed to undergo expansion and differentiation into GC B cells in the spleen, Ab titers were reduced, and splenic IgG production was inhibited nearly 10-fold when the Ag was administered during infection. Our data provide a mechanism whereby an intracellular bacterial infection can compromise local immunity to coinfecting pathogens or antigenic challenge.
Figures
Similar articles
-
CD11c expression identifies a population of extrafollicular antigen-specific splenic plasmablasts responsible for CD4 T-independent antibody responses during intracellular bacterial infection.J Immunol. 2008 Jul 15;181(2):1375-85. doi: 10.4049/jimmunol.181.2.1375. J Immunol. 2008. PMID: 18606692 Free PMC article.
-
IgM production by bone marrow plasmablasts contributes to long-term protection against intracellular bacterial infection.J Immunol. 2011 Jan 15;186(2):1011-21. doi: 10.4049/jimmunol.1002836. Epub 2010 Dec 8. J Immunol. 2011. PMID: 21148037 Free PMC article.
-
Antigen-driven induction of polyreactive IgM during intracellular bacterial infection.J Immunol. 2012 Aug 1;189(3):1440-7. doi: 10.4049/jimmunol.1200878. Epub 2012 Jun 22. J Immunol. 2012. PMID: 22730531 Free PMC article.
-
T Cell Subsets in the Germinal Center: Lessons from the Macaque Model.Front Immunol. 2018 Feb 26;9:348. doi: 10.3389/fimmu.2018.00348. eCollection 2018. Front Immunol. 2018. PMID: 29535724 Free PMC article. Review.
-
Antibody-mediated immunity against intracellular pathogens: two-dimensional thinking comes full circle.Infect Immun. 2003 Aug;71(8):4225-8. doi: 10.1128/IAI.71.8.4225-4228.2003. Infect Immun. 2003. PMID: 12874297 Free PMC article. Review. No abstract available.
Cited by
-
Recent Advances in the Immunologic Method Applied to Tick-Borne Diseases in Brazil.Pathogens. 2022 Aug 2;11(8):870. doi: 10.3390/pathogens11080870. Pathogens. 2022. PMID: 36014992 Free PMC article. Review.
-
Neutralization of the Plasmodium-encoded MIF ortholog confers protective immunity against malaria infection.Nat Commun. 2018 Jul 13;9(1):2714. doi: 10.1038/s41467-018-05041-7. Nat Commun. 2018. PMID: 30006528 Free PMC article.
-
Immune response and immunopathology during toxoplasmosis.Semin Immunopathol. 2012 Nov;34(6):793-813. doi: 10.1007/s00281-012-0339-3. Epub 2012 Sep 7. Semin Immunopathol. 2012. PMID: 22955326 Free PMC article. Review.
-
Protective neutralizing influenza antibody response in the absence of T follicular helper cells.Nat Immunol. 2016 Dec;17(12):1447-1458. doi: 10.1038/ni.3563. Epub 2016 Oct 31. Nat Immunol. 2016. PMID: 27798619
-
CD11c+ T-bet+ memory B cells: Immune maintenance during chronic infection and inflammation?Cell Immunol. 2017 Nov;321:8-17. doi: 10.1016/j.cellimm.2017.07.006. Epub 2017 Jul 19. Cell Immunol. 2017. PMID: 28838763 Free PMC article. Review.
References
-
- MacLennan IC. Germinal centers. Annu. Rev. Immunol. 1994;12:117–139. - PubMed
-
- Kelsoe G. The germinal center: a crucible for lymphocyte selection. Semin. Immunol. 1996;8:179–184. - PubMed
-
- Klaus GG, Humphrey JH, Kunkl A, Dongworth DW. The follicular dendritic cell: its role in antigen presentation in the generation of immunological memory. Immunol. Rev. 1980;53:3–28. - PubMed
-
- Wu J, Qin D, Burton GF, Szakal AK, Tew JG. Follicular dendritic cell-derived antigen and accessory activity in initiation of memory IgG responses in vitro. J. Immunol. 1996;157:3404–3411. - PubMed
-
- Tarlinton DM, Smith KG. Dissecting affinity maturation: a model explaining selection of antibody-forming cells and memory B cells in the germinal centre. Immunol. Today. 2000;21:436–441. - PubMed
Publication types
MeSH terms
Substances
Grants and funding
LinkOut - more resources
Full Text Sources
Research Materials
Miscellaneous
