. 2010 Jun 10;115(23):4742-9.
doi: 10.1182/blood-2009-10-249540. Epub 2010 Mar 29.

Toll-like receptor-induced changes in glycolytic metabolism regulate dendritic cell activation

Affiliations

Toll-like receptor-induced changes in glycolytic metabolism regulate dendritic cell activation

Connie M Krawczyk et al. Blood. .

Abstract

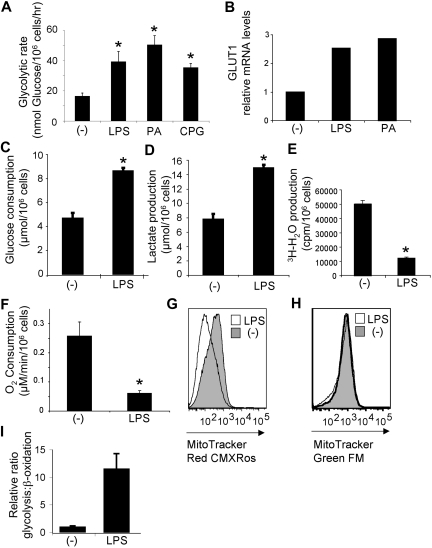
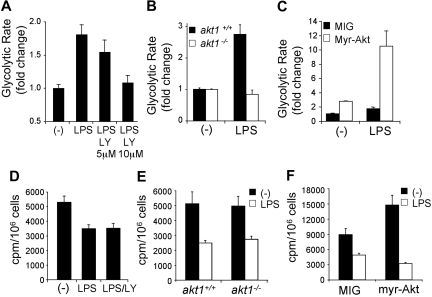
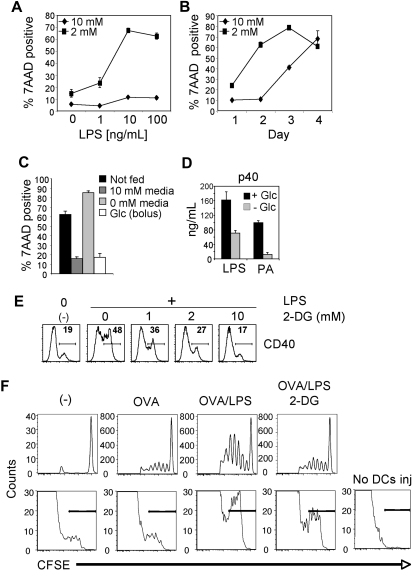
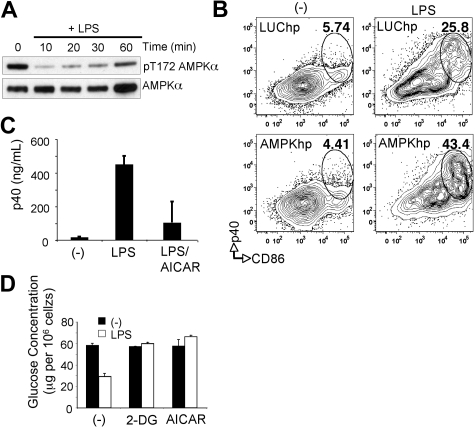
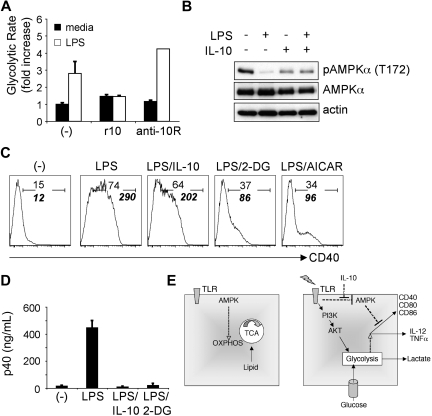
Dendritic cells (DCs) are key regulators of innate and acquired immunity. The maturation of DCs is directed by signal transduction events downstream of toll-like receptors (TLRs) and other pattern recognition receptors. Here, we demonstrate that, in mouse DCs, TLR agonists stimulate a profound metabolic transition to aerobic glycolysis, similar to the Warburg metabolism displayed by cancer cells. This metabolic switch depends on the phosphatidyl inositol 3'-kinase/Akt pathway, is antagonized by the adenosine monophosphate (AMP)-activated protein kinase (AMPK), and is required for DC maturation. The metabolic switch induced by DC activation is antagonized by the antiinflammatory cytokine interleukin-10. Our data pinpoint TLR-mediated metabolic conversion as essential for DC maturation and function and reveal it as a potential target for intervention in the control of excessive inflammation and inappropriately regulated immune responses.


Figures

Figure 1
Figure 1
DC activation by TLR ligands induces a metabolic switch to aerobic glycolysis. (A) Glycolytic rate of DCs after18 hours of culture in medium alone (-) or with the TLR4, TLR2, and TLR9 ligands, LPS, heat-killed PA or cytosine phosphate guanosine (CpG). (B) Glucose transporter 1 (GLUT1) expression by DCs analyzed by quantitative RT-PCR. (C) Glucose consumption by resting (-) and LPS-activated DCs. (D) Lactate production by resting (-) and LPS-activated DCs. (E) Rate of mitochondrial fatty acid β-oxidation in DCs cultured for 18 hours in medium alone (-) or after stimulation with LPS. (F) Mitochondrial O2 consumption of resting (-) or LPS-stimulated DCs. (G) Mitochondrial potential, as assessed by fluorescence with the MitoTracker Red CMXRos. (H) Mitochondrial mass, assessed by fluorescence with the MitoTracker Green FM. (G-H) The y-axis indicates cell number. (I) The glycolysis/β-oxidation ratio for DCs stimulated with LPS. Bars represent mean values ± SDs from 3 independent replicates; *P < .05 compared with unstimulated controls (-). All data are representative of 2 to 4 independent experiments.
Figure 2
Figure 2
TLRs induce glycolytic metabolism in DCs through the PI3K/Akt pathway. (A) Glycolytic rate of DCs stimulated with LPS in the presence of the indicated concentrations of the PI3K inhibitor LY294002. (B) Glycolytic rate after LPS stimulation in akt1+/+ and akt1−/− DCs. The fold change in glycolytic rate was calculated relative to the untreated control for each genotype. (C) Glycolytic rate of DCs transduced with the retroviral vectors MIG (control) or MIG–active form of Akt (myr-Akt). The data represent the fold increase in glycolytic rate relative to unstimulated MIG-transduced DCs. (D) Rate of mitochondrial fatty acid β-oxidation in DCs cultured for 18 hours in medium alone (-) or after stimulation with LPS in the presence or absence of the PI3K inhibitor LY294002. (E) Rate of mitochondrial fatty acid β-oxidation in wild-type (akt1+/+) or Akt-deficient (akt1−/−) DCs cultured for 18 hours in medium alone (-) or after stimulation with LPS. (F) Rate of mitochondrial fatty acid β-oxidation in DCs transduced with empty vector (MIG) or expressing myr-Akt. Bars represent mean value of replicates. Error bars represent SDs. All data are representative of 2 or more independent experiments.
Figure 3
Figure 3
Glycolysis is essential for cellular activation and survival after exposure to TLR agonists. (A) Survival of DCs 2 days after stimulation with LPS in 10mM or 2mM glucose. (B) Survival of DCs over time after stimulation with LPS in media containing either 10mM or 2mM glucose. Data points represent the percentage of 7-amino-actinomycin D (7AAD)–positive cells as determined by flow cytometry. (C) Survival of DCs after glucose supplementation. DCs were cultured for 2 days in the presence of 10mM glucose. On day 2, the media was either left unchanged (not fed) or supplemented with 10mM glucose (bolus) or replaced with media containing 10 or 0mM glucose. Cell viability was determined 24 hours later by 7AAD uptake. (A-C) Error bars are SDs from triplicate measurements. (D) Cytokine (p40) production by DCs in response to TLR agonists in the presence or absence of glucose. Cytokine production was determined by enzyme-linked immunoabsorbent assay 18 hours after activation. (E) LPS-induced activation of DCs in the presence of the glycolytic inhibitor 2-DG. Flow cytometry was used to measure surface expression of CD40 after LPS stimulation in the presence of the indicated concentrations of 2-DG. Unstimulated DCs cultured in the absence of 2-DG or LPS are shown for comparison (-). Numbers represent the percentage of cells staining positive for CD40. (F top) DO11.10 CD4+ T-cell proliferative responses, measured by CFSE-dilution, in adoptively transferred mice immunized 4 days previously with DCs alone (-), or DCs pulsed with OVA alone, DCs pulsed with OVA plus LPS, or DCs pulsed with OVA plus LPS in the presence of 10mM 2-DG. Plots are gated on KJ126+CD4+ cells. (F bottom) Numbers of CFSE-stained CD11c+ cells in LNs draining sites of injection 2 days previously with CFSE-labeled DCs pulsed with OVA alone, pulsed with OVA plus LPS, or pulsed with OVA plus LPS in the presence of 10mM 2-DG. The panel to the right shows the absence of CFSE signal in control popliteal LNs draining noninjected sites. Bars indicate CFSE-positive cells. All data are representative of 2 to 5 independent experiments.
Figure 4
Figure 4
AMPK antagonizes DC activation. (A) Extracts of DCs stimulated with LPS for the times shown were probed by Western blotting with antibodies specific for phosphorylated Thr-172 AMPKα or for total AMPKα. (B) LPS-induced maturation, measured as p40 production and CD86 expression, as measured by flow cytometry in DCs transduced with AMPK shRNAs or control Luc shRNAs. (-) denotes resting DCs; numbers indicate percentage of CD11c+ cells within gates. (C) p40 production by resting DCs (-) and DCs stimulated with LPS or LPS plus AICAR. Cytokine production was determined by enzyme-linked immunoabsorbent assay 18 hours after activation. (D) Glucose consumption (measured as glucose remaining in culture medium after 24 hours of culture, normalized per 106 cells) by DCs cultured without or with LPS in the absence (-) or presence of 2-DG or AICAR. Bars represent mean values ± SDs from 3 independent replicates. All data are representative of 2 or more independent experiments.
Figure 5
Figure 5
IL-10 inhibits the metabolic switch to glycolysis induced by TLR agonists. (A) Fold increase in the glycolytic rate of DCs cultured without or with LPS in the absence (-) or presence of recombinant IL-10 (r10) or anti–IL-10R Ab (anti-10R). (B) AMPK phosphorylation in DCs stimulated with LPS, IL-10, or LPS plus IL-10. DCs were treated as indicated for 30 minutes, and lysates were probed by Western blotting with antibodies specific for phosphorylated AMPKα (Thr-172), or for total AMPKα or for actin (as loading controls). (C) LPS-induced expression of CD40 by IL-10−/− DCs is inhibited by exogenous IL-10, 2-DG, and AICAR. CD40 expression at 6 hours after stimulation was measured by flow cytometry. (-) denotes unstimulated DCs. Plain numbers represent the percentage of cells within the positive gate, and bold italic numbers represent mean fluorescence intensities. (D) IL-10 and 2-DG are equally potent at inhibiting LPS-induced cytokine (p40) production. Cytokine levels in supernatants from cells cultured for 18 hours without (-) or with LPS, plus minus IL-10 or 2-DG, were measured by enzyme-linked immunoabsorbent assay. Bars represent mean values ± SDs from 3 independent replicates. All data are representative of 2 or more independent experiments. (E) A summary of findings.

Similar articles

Cited by

References

    1. Barton GM, Medzhitov R. Control of adaptive immune responses by Toll-like receptors. Curr Opin Immunol. 2002;14(3):380–383. - PubMed
    1. Krawczyk CM, Shen H, Pearce EJ. Functional plasticity in memory T helper cell responses. J Immunol. 2007;178(7):4080–4088. - PubMed
    1. Akira S, Takeda K. Toll-like receptor signalling. Nat Rev Immunol. 2004;4(7):499–511. - PubMed
    1. Iwasaki A, Medzhitov R. Toll-like receptor control of the adaptive immune responses. Nat Immunol. 2004;5(10):987–995. - PubMed
    1. Huang Q, Liu D, Majewski P, et al. The plasticity of dendritic cell responses to pathogens and their components. Science. 2001;294(5543):870–875. - PubMed

Publication types

MeSH terms