

The promise of prevention: the effects of four preventable risk factors on national life expectancy and life expectancy disparities by race and county in the United States
- PMID: 20351772
- PMCID: PMC2843596
- DOI: 10.1371/journal.pmed.1000248
The promise of prevention: the effects of four preventable risk factors on national life expectancy and life expectancy disparities by race and county in the United States
Erratum in
- PLoS Med. 2011 Feb;8(2). doi: 10.1371/annotation/a9616323-4cad-4b65-b792-e0975a536a52 doi: 10.1371/annotation/a9616323-4cad-4b65-b792-e0975a536a52
Abstract
Background: There has been substantial research on psychosocial and health care determinants of health disparities in the United States (US) but less on the role of modifiable risk factors. We estimated the effects of smoking, high blood pressure, elevated blood glucose, and adiposity on national life expectancy and on disparities in life expectancy and disease-specific mortality among eight subgroups of the US population (the "Eight Americas") defined on the basis of race and the location and socioeconomic characteristics of county of residence, in 2005.
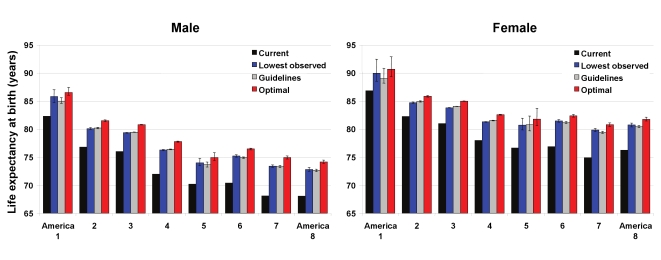
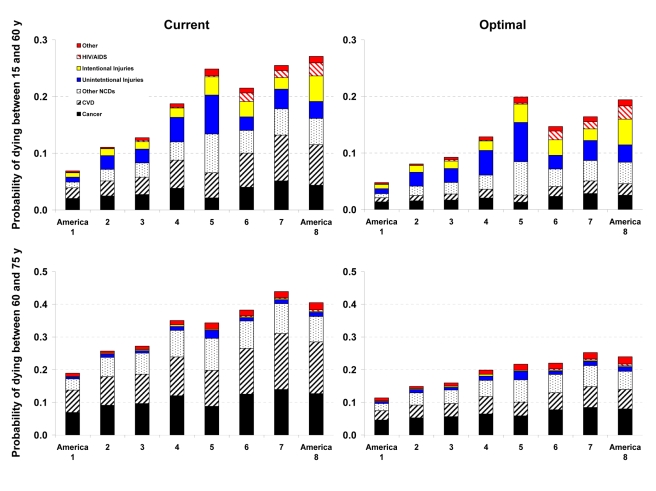
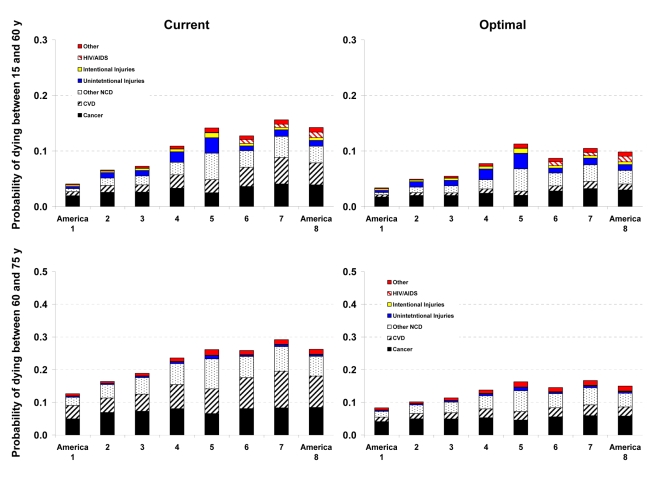
Methods and findings: We combined data from the National Health and Nutrition Examination Survey and the Behavioral Risk Factor Surveillance System to estimate unbiased risk factor levels for the Eight Americas. We used data from the National Center for Health Statistics to estimate age-sex-disease-specific number of deaths in 2005. We used systematic reviews and meta-analyses of epidemiologic studies to obtain risk factor effect sizes for disease-specific mortality. We used epidemiologic methods for multiple risk factors to estimate the effects of current exposure to these risk factors on death rates, and life table methods to estimate effects on life expectancy. Asians had the lowest mean body mass index, fasting plasma glucose, and smoking; whites had the lowest systolic blood pressure (SBP). SBP was highest in blacks, especially in the rural South--5-7 mmHg higher than whites. The other three risk factors were highest in Western Native Americans, Southern low-income rural blacks, and/or low-income whites in Appalachia and the Mississippi Valley. Nationally, these four risk factors reduced life expectancy at birth in 2005 by an estimated 4.9 y in men and 4.1 y in women. Life expectancy effects were smallest in Asians (M, 4.1 y; F, 3.6 y) and largest in Southern rural blacks (M, 6.7 y; F, 5.7 y). Standard deviation of life expectancies in the Eight Americas would decline by 0.50 y (18%) in men and 0.45 y (21%) in women if these risks had been reduced to optimal levels. Disparities in the probabilities of dying from cardiovascular diseases and diabetes at different ages would decline by 69%-80%; the corresponding reduction for probabilities of dying from cancers would be 29%-50%. Individually, smoking and high blood pressure had the largest effect on life expectancy disparities.
Conclusions: Disparities in smoking, blood pressure, blood glucose, and adiposity explain a significant proportion of disparities in mortality from cardiovascular diseases and cancers, and some of the life expectancy disparities in the US. Please see later in the article for the Editors' Summary.
Conflict of interest statement
The authors have declared that no competing interests exist.
Figures
References
-
- Murray CJ, Kulkarni SC, Michaud C, Tomijima N, Bulzacchelli MT, et al. Eight Americas: investigating mortality disparities across races, counties, and race-counties in the United States. PLoS Med. 2006;3:e260. doi: 10.1371/journal.pmed.0030260. - DOI - PMC - PubMed
-
- Ezzati M, Friedman AB, Kulkarni SC, Murray CJ. The reversal of fortunes: trends in county mortality and cross-county mortality disparities in the United States. PLoS Med. 2008;5:e66. doi: 10.1371/journal.pmed.0050066. - DOI - PMC - PubMed
-
- Harper S, Lynch J, Burris S, Davey SG. Trends in the black-white life expectancy gap in the United States, 1983-2003. JAMA. 2007;297:1224–1232. - PubMed
-
- Singh GK, Siahpush M. Widening socioeconomic inequalities in US life expectancy, 1980-2000. Int J Epidemiol. 2006;35:969–979. - PubMed
-
- Hahn RA, Eberhardt S. Life expectancy in four U.S. racial/ethnic populations: 1990. Epidemiology. 1995;6:350–355. - PubMed
Publication types
MeSH terms
Grants and funding
LinkOut - more resources
Full Text Sources
Medical
