. 2010 Mar 11:1:23-41.
doi: 10.4137/oed.s2854.

Early Involvement of Immune/Inflammatory Response Genes in Retinal Degeneration in DBA/2J Mice

Affiliations

Early Involvement of Immune/Inflammatory Response Genes in Retinal Degeneration in DBA/2J Mice

W Fan et al. Ophthalmol Eye Dis. .

Abstract

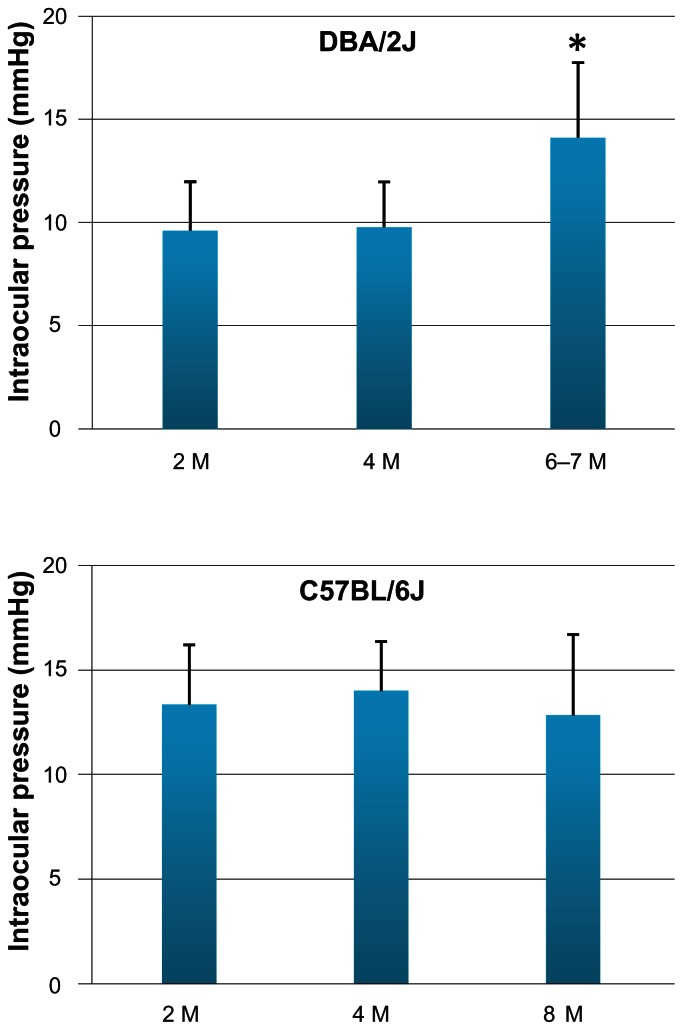
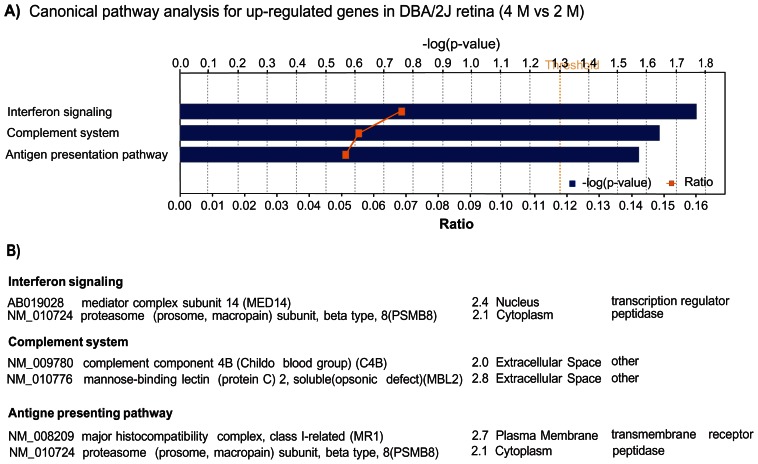
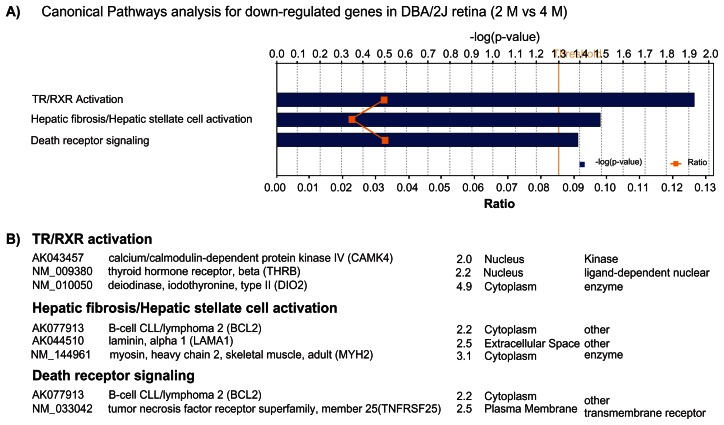
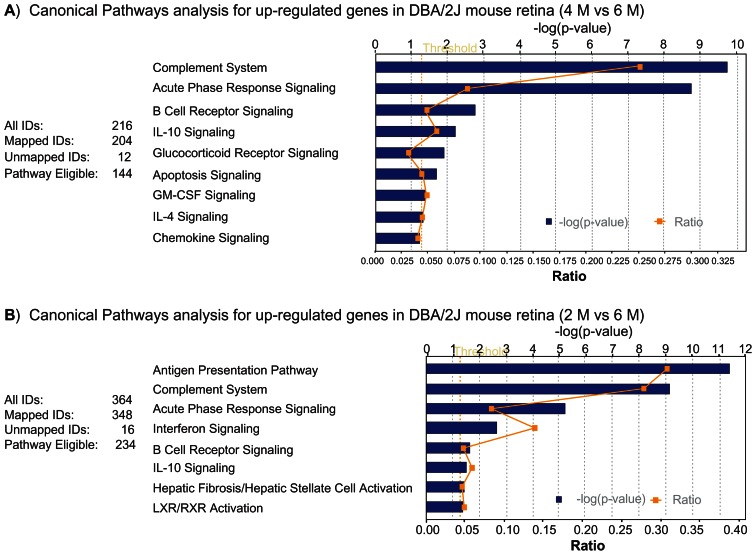
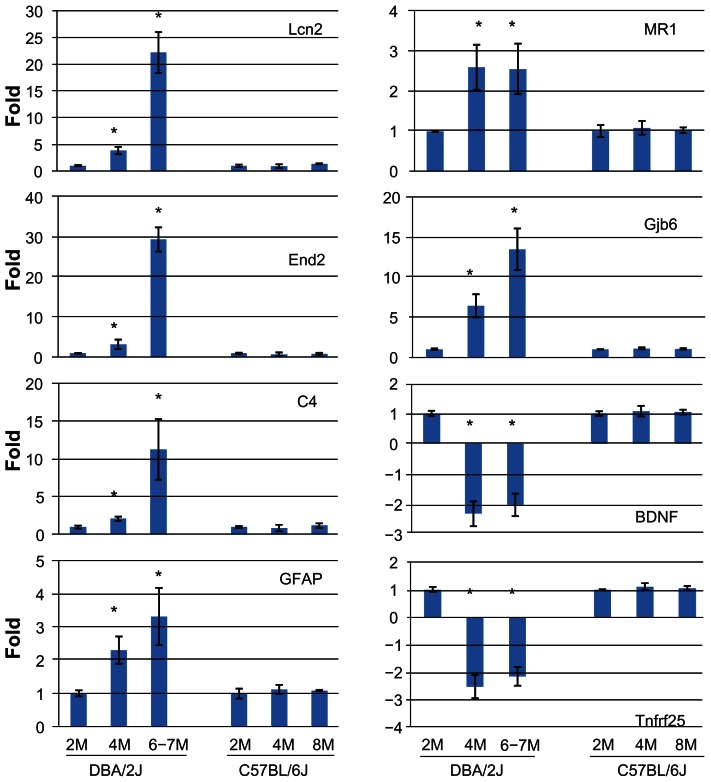
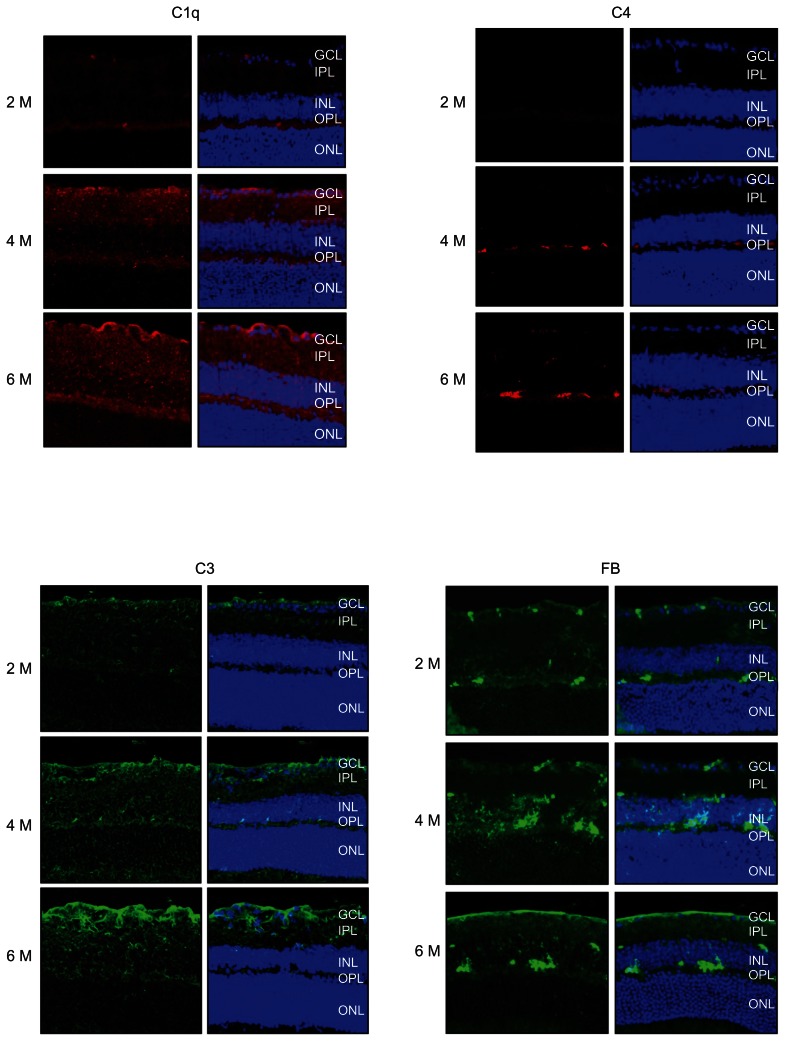
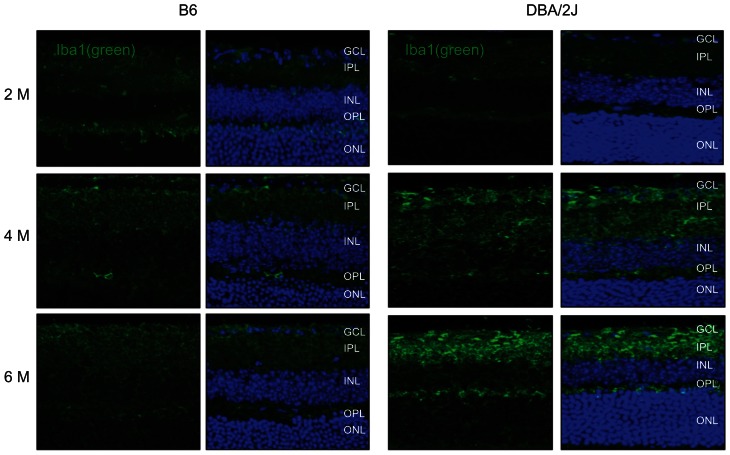
PURPOSE: The DBA/2J (D2) mouse carries mutations in two of its genes, Tyrp1 and Gpnmb. These alterations result in the development of an immune response in the iris, leading to iris atrophy and pigment dispersion. The development of elevated intraocular pressure (IOP) in this model of glaucoma is considered to be a significant factor leading to the death of retinal ganglion cells (RGCs). Changes in gene expression in the retina have already been correlated with the appearance of elevated IOP in the D2 mouse. The purpose of the present study was to determine if any changes in gene expression occur prior to the development of IOP. METHODS: The IOP was measured monthly using a rebound tonometer in D2 and age-matched C57/BL6 (B6) mice (normal controls). D2 animals with normal IOP at 2 and 4 M were used. In addition, mice at the age of 6-7 M were included to look for any trends in gene expression that might develop during the progression of the disease. Separate RNA samples were prepared from each of three individual retinas for each age, and gene expression profiles were determined with the aid of mouse oligonucleotide arrays (Agilent). A subset of genes was examined with the aid of real-time PCR. Immunocytochemistry was used to visualize changes in the retina for some of the gene-products. RESULTS: Four hundred and thirteen oligonucleotide probes were differentially expressed in the retinas of 4 M versus 2 M old D2 mice. The most significantly up-regulated genes (181) were associated with immune responses including interferon signaling, the complement system and the antigen presentation pathway, whereas the down-regulated genes (232) were linked to pathways related to cell death and known neurological diseases/disorders. These particular changes were not revealed in the age-matched B6 mice. By 6 M, when IOP started to increase in many of the D2 mice, more robust changes of these same genes were observed. Changes in the levels of selected genes, representative of different functions/pathways, were validated with RT-PCR, and changes in glial responses were visualized in the retina with immunocytochemistry. CONCLUSIONS: The results showed that the expression of genes related to the immune response and acute stress were altered independently of the development of elevated IOP, and indicated early involvement of the immune system in the onset of the disease. The later development of elevated IOP, observed in this animal model, was coincident with continued changes in expression of genes observed at earlier time points. Further studies are warranted to identify the roles of specific genes identified here with respect to the death of the RGCs.


Figures

Figure 1
Figure 1
IOP measurements in the experimental animals. IOP was measured monthly in D2 (n =6 for each time point) and B6 mice (n =3 for each time point) using the rebound tonometer. The animals with “normal” IOP at the age of 2 and 4 M were used for comparative analyses of retinal gene expression levels which would be independent of changes in IOP levels. D2 mice at ages of 6–7 M and B6 mice at the age of 8 M were included to see if there were any changes in gene expression that may be associated with changes in IOP. Many D2 mice had started to develop higher IOP by 6–7 M, whereas the IOP of B6 mice at 8 M had not changed relative to that observed at younger ages. *P < 0.05, ANOVA.
Figure 2
Figure 2
A) Significantly affected canonical pathways containing up-regulated genes in the retina of D2 mice at the age of 4 M. Bars represent-log (p-value) for over-representation of affected genes in the selected pathway. The yellow line represents the ratio of affected genes to the total number of genes in a pathway. Threshold (grey line) denotes the p = 0.05 level. B) List of genes in each of the pathways.
Figure 3
Figure 3
A) Most significant affected canonical pathways containing down-regulated genes in the retina of D2 mice at the age of 4 M. Bars represent -log(p-value) for over-representation of affected genes in the selected pathway. The yellow line represents the ratio of affected genes to the total number of genes in a pathway. Threshold (grey line) denotes the p = 0.05 level. B) List of genes in each of the pathways.
Figure 4
Figure 4
Trend in altered gene expression values. A) Canonical pathway for up-regulated genes in D2 retina (4 M vs. 6–7 M); B) Canonical pathway for up-regulated genes in D2 retina (2 M vs. 6–7 M). Bars represent-log (p-value) for over-representation of affected genes in the selected pathway. The yellow line represents the ratio of affected genes to the total number of genes in a pathway. Threshold (grey line) denotes the p = 0.05 level.
Figure 5
Figure 5
Real time PCR confirmation of selected genes identified by microarray analysis. Real time PCR was performed using individual retinal RNA samples from D2 animals at 2, 4, and 6–7 M (n =6 eyes for each time point), or B6 animals at 2, 4 and 8 M (n =3 eyes for each time point). The graphs show the average change relative to gene expression levels at 2 M (whose expression level was taken as 1) for either D2 or B6 mice. *Statistically significant differences (P < 0.05) by ANOVA.
Figure 6
Figure 6
Immunofluorescence microscopy was used to detect the presence and localization of protein products for some of the genes shown to have altered expression values in the retinas of D2 mice. For each gene-product, 3 ages are shown (2, 4 and 6 M) with the left-hand column of figures, not counter-stained, and the right-hand column counter-stained with propidium iodide, to show cellular nuclei, and for visualization of the retinal cell layers. The gene products examined included: C1q, C3, C4, factor B and Lcn2. C1q, C3 and FB revealed similar patterns of localization, with immunolabeling evident from the inner limiting membrane, the GCL through the OPL. In addition, Lcn2 and C4 shared similar patterns of expression, but these proteins were mainly located in OPL with some scattered presence within the IPL. Bar: 20 μM. Abbreviations: GCL, ganglion cell layer; IPL, inner plexiform layer; INL, inner nuclear layer; OPL, outer plexiform layer; ONL, outer nuclear layer.
Figure 6
Figure 6
Immunofluorescence microscopy was used to detect the presence and localization of protein products for some of the genes shown to have altered expression values in the retinas of D2 mice. For each gene-product, 3 ages are shown (2, 4 and 6 M) with the left-hand column of figures, not counter-stained, and the right-hand column counter-stained with propidium iodide, to show cellular nuclei, and for visualization of the retinal cell layers. The gene products examined included: C1q, C3, C4, factor B and Lcn2. C1q, C3 and FB revealed similar patterns of localization, with immunolabeling evident from the inner limiting membrane, the GCL through the OPL. In addition, Lcn2 and C4 shared similar patterns of expression, but these proteins were mainly located in OPL with some scattered presence within the IPL. Bar: 20 μM. Abbreviations: GCL, ganglion cell layer; IPL, inner plexiform layer; INL, inner nuclear layer; OPL, outer plexiform layer; ONL, outer nuclear layer.
Figure 7
Figure 7
Activation of micro-glial cells in the D2 retina. Fixed tissue sections of retina from both D2 and B6 mice at the age of 2 M, 4 M and 6 M were collected and immunolabeled for the protein, Iba1 (green). An elevated level of antibody binding to Iba1 was detected in the GCL and IPL in D2 retinas at 4 M when compared to 2 M. At 6 M, the labeling was further elevated and now more extensive from the GCL to the OPL. Compared to 2 M retinas from the D2 mice, Iba1-labeled micro-glial cells were less ramified with round somata at 4 and 6 M of age. These changes were not evident in age-matched B6 retinas. Bar: 20 μM. Abbreviations: GCL, ganglion cell layer; IPL, inner plexiform layer; INL, inner nuclear layer; OPL, outer plexiform layer; ONL, outer nuclear layer.

References

    1. Quigley HA, Broman AT. The number of people with glaucoma worldwide in 2010 and 2020. Br J Ophthalmol. 2006;90:262–7. - PMC - PubMed
    1. John SW, Smith RS, Savinova OV, et al. Essential iris atrophy, pigment dispersion, and glaucoma in DBA/2J mice. Invest Ophthalmol Vis Sci. 1998;39:951–62. - PubMed
    1. Anderson MG, Smith RS, Hawes NL, et al. Mutations in genes encoding melanosomal proteins cause pigmentary glaucoma in DBA/2J mice. Nat Genet. 2002;30:81–5. - PubMed
    1. Anderson MG, Libby RT, Mao M, et al. Genetic context determines susceptibility to intraocular pressure elevation in a mouse pigmentary glaucoma. BMC Biol. 2006;4:20. - PMC - PubMed
    1. Chang B, Smith RS, Hawes NL, et al. Interacting loci cause severe iris atrophy and glaucoma in DBA/2J mice. Nat Genet. 1999;21:405–9. - PubMed

LinkOut - more resources