

Genomic and geographic distribution of private SNPs and pathways in human populations
- PMID: 20352079
- PMCID: PMC2843937
- DOI: 10.2217/pme.09.54
Genomic and geographic distribution of private SNPs and pathways in human populations
Abstract
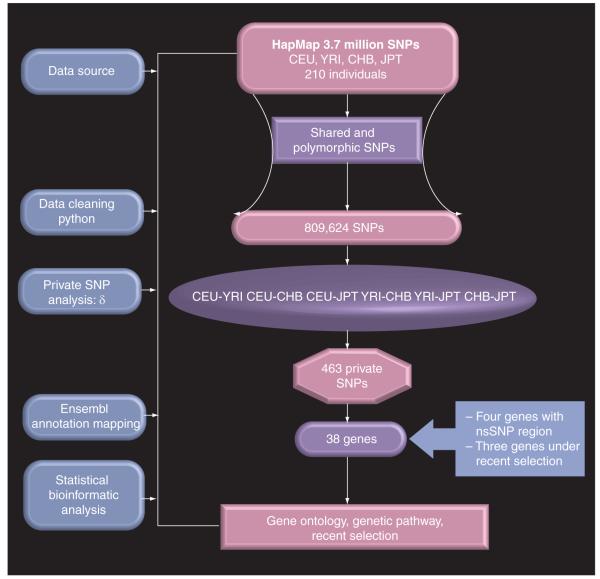
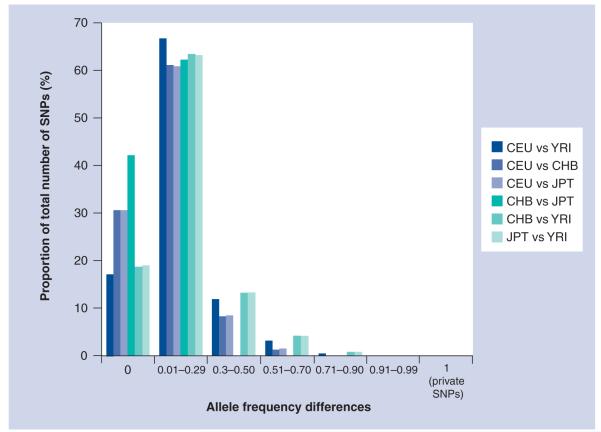
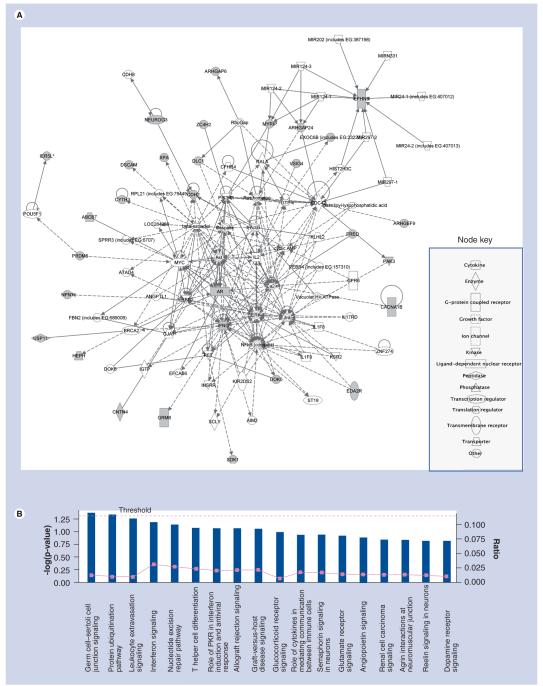
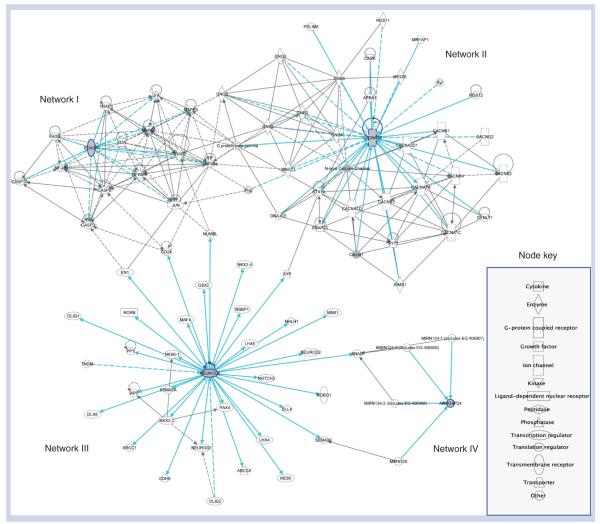
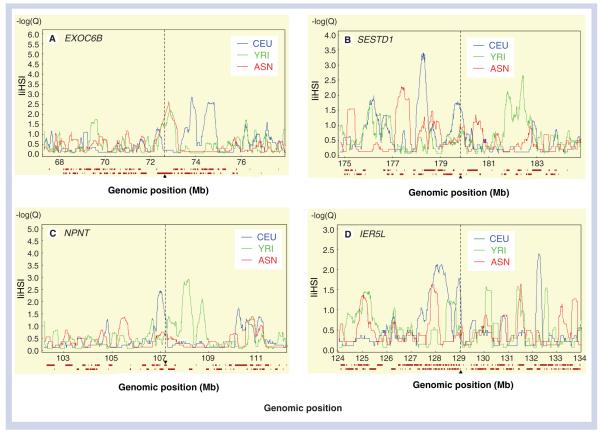
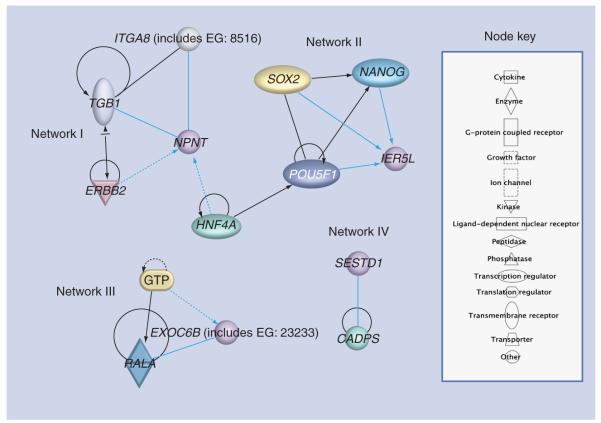
AIMS: Geography-based genetic differentials operating on entire biochemical pathways may reflect different adaptive evolutionary processes that separated populations may have undergone. They may also influence treatment outcome for a variety of drugs - an emerging and important area of study. This research article leverages the International HapMap Consortium data to identify pathway components that differ in genotype frequency for four populations: individuals of Northern European descent from the USA (CEU), individuals from West Africa (YRI), Japan (JPT) and China (CHB). MATERIALS #ENTITYSTARTX00026; METHODS: By identifying loci with fixed or large frequency differences (δ = 1) between paired population samples (CEU vs YRI, CEU vs CHB, CEU vs JPT, YRI vs CHB, YRI vs JPT and CHB vs JPT), and reconstructing the physiological functions of genes at these loci, we report a list of pathways affected by natural selection during human evolution. RESULTS: Of the 3.7 million HapMap SNPs, 463 loci (which mapped to 38 genes) were fixed (δ = 1) in at least one population pair. These private loci included four nonsynonymous coding SNPs: rs4536103 (NEUROG3), rs1385699 (EDA2R), rs11946338 (ARHGAP24) and rs4422842 (CACNA1B). A total of four additional genes demonstrated evidence of recent positive selection: three genes in European subjects (IER5L, NPNT and SESTD1) and a single gene in Asian subjects (EXOC6B). DISCUSSION: Gene ontology and pathway analyses suggest that cellular differentiation, apoptosis and activation of the NF-κB transcription factor vary between populations in genomic regions of fixed (private) SNPs identified in this study. Variability in these pathways may provide important clues into the mechanisms of human adaptation to different environments. An improved understanding of their variability may also help to explain race-specific differences in the treatment outcomes observed for a variety of modern drugs.
Figures
Similar articles
-
[A cross-racial analysis on the susceptible gene polymorphisms of salt-sensitive hypertension].Zhonghua Xin Xue Guan Bing Za Zhi. 2010 Oct;38(10):943-8. Zhonghua Xin Xue Guan Bing Za Zhi. 2010. PMID: 21176642 Chinese.
-
[Analysis of the HapMap data on SNPs in SUMO1 and association study of rs7599810 in trios with non-syndromic cleft lip with or without cleft palate].Beijing Da Xue Xue Bao Yi Xue Ban. 2014 Apr 18;46(2):258-63. Beijing Da Xue Xue Bao Yi Xue Ban. 2014. PMID: 24743817 Chinese.
-
Geographical affinities of the HapMap samples.PLoS One. 2009;4(3):e4684. doi: 10.1371/journal.pone.0004684. Epub 2009 Mar 4. PLoS One. 2009. PMID: 19259268 Free PMC article.
-
[Comparison of minor allele frequency and haplotype frequencies for single nucleotide polymorphisms in receptor tyrosine kinase-like orphan receptor 2 gene using HapMap data from Han Chinese in Beijing (CHB) and Japanese in Tokyo (JPT)].Zhonghua Liu Xing Bing Xue Za Zhi. 2011 Nov;32(11):1162-5. Zhonghua Liu Xing Bing Xue Za Zhi. 2011. PMID: 22336557 Chinese.
-
Folic acid supplementation and malaria susceptibility and severity among people taking antifolate antimalarial drugs in endemic areas.Cochrane Database Syst Rev. 2022 Feb 1;2(2022):CD014217. doi: 10.1002/14651858.CD014217. Cochrane Database Syst Rev. 2022. PMID: 36321557 Free PMC article.
Cited by
-
Detection and Classification of Hard and Soft Sweeps from Unphased Genotypes by Multilocus Genotype Identity.Genetics. 2018 Dec;210(4):1429-1452. doi: 10.1534/genetics.118.301502. Epub 2018 Oct 12. Genetics. 2018. PMID: 30315068 Free PMC article.
-
Genotype-environment interactions and their translational implications.Per Med. 2011 Jan;8(1):59-70. doi: 10.2217/pme.10.75. Per Med. 2011. PMID: 21660115 Free PMC article.
-
Identifying and Classifying Shared Selective Sweeps from Multilocus Data.Genetics. 2020 May;215(1):143-171. doi: 10.1534/genetics.120.303137. Epub 2020 Mar 9. Genetics. 2020. PMID: 32152048 Free PMC article.
-
The emergence of human-evolutionary medical genomics.Evol Appl. 2011 Mar;4(2):292-314. doi: 10.1111/j.1752-4571.2010.00156.x. Epub 2010 Oct 12. Evol Appl. 2011. PMID: 25567974 Free PMC article.
-
Do medicine and cell biology talk to each other? A study of vocabulary similarities between fields.Braz J Med Biol Res. 2021 Oct 18;54(12):e11728. doi: 10.1590/1414-431X2021e11728. eCollection 2021. Braz J Med Biol Res. 2021. PMID: 34669784 Free PMC article.
References
-
-
Paabo S. The mosaic that is our genome. Nature. 2003;421:409–412. ■■ Report about the heterogeneity of the genome.
-
-
- Biswas S, Akey JM. Genomic insights into positive selection. Trends Genet. 2006;22:437–446. - PubMed
Grants and funding
LinkOut - more resources
Full Text Sources