

Cortical thickness and subcortical gray matter reductions in neuropsychiatric systemic lupus erythematosus
- PMID: 20352085
- PMCID: PMC2844408
- DOI: 10.1371/journal.pone.0009302
Cortical thickness and subcortical gray matter reductions in neuropsychiatric systemic lupus erythematosus
Abstract
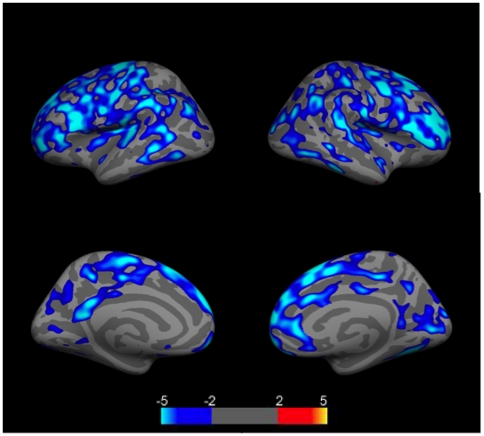
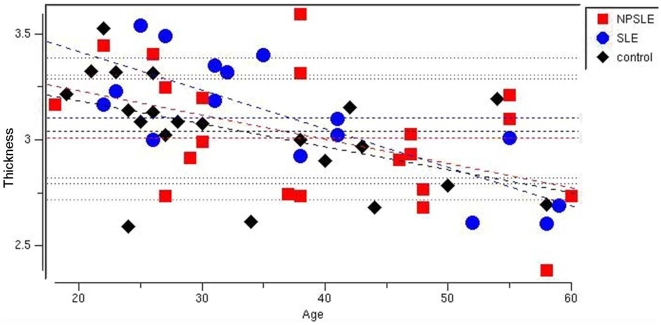
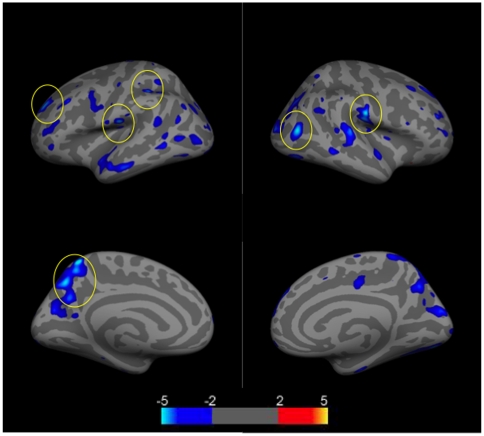
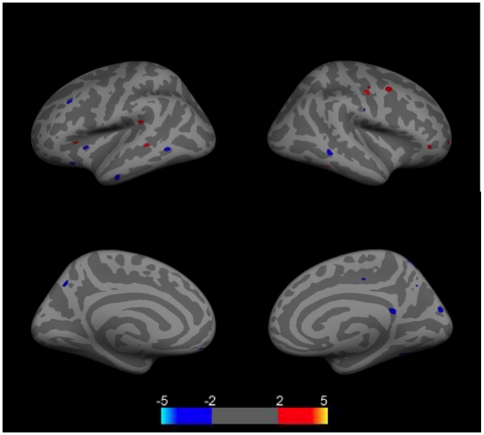
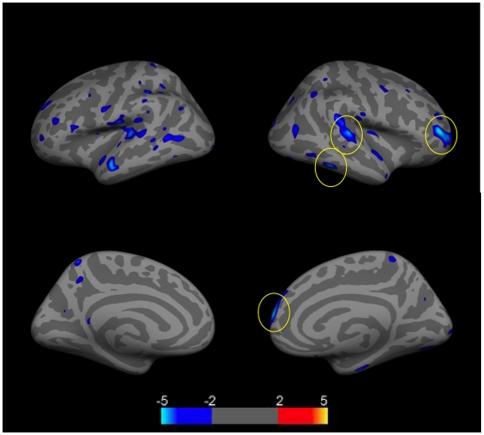
Within systemic lupus erythematosus (SLE) patients can be divided into groups with and without central nervous system involvement, the latter being subcategorized as neuropsychiatric systemic lupus erythematosus (NPSLE). While a number of research groups have investigated NPSLE, there remains a lack of consistent application of this diagnostic criteria within neuroimaging studies. Previous neuroimaging research suggests that SLE patients have reduced subcortical and regional gray matter volumes when compared to controls, and that these group differences may be driven by SLE patients with neuropsychiatric symptoms. The current study sought to compare measures of cortical thickness and subcortical structure volume between NPSLE, SLE, and healthy controls. We hypothesized that patients with NPSLE (N = 21) would have thinner cortex and reduced subcortical gray matter volumes when compared to SLE (N = 16) and control subjects (N = 21). All subjects underwent MRI examinations on a 1.5 Tesla Siemens Sonata scanner. Anatomical reconstruction and segmentation were performed using the FreeSurfer image analysis suite. Cortical and subcortical volumes were extracted from FreeSurfer and analyzed for group differences, controlling for age. The NPSLE group exhibited decreased cortical thickness in clusters of the left frontal and parietal lobes as well as in the right parietal and occipital lobes compared to control subjects. Compared to the SLE group, the NPSLE group exhibited comparable thinning in clusters of the frontal and temporal lobes. Controlling for age, we found that between group effects for subcortical gray matter structures were significant for the thalamus (F = 3.06, p = .04), caudate nucleus (F = 3.19, p = .03), and putamen (F = 4.82, p = .005). These results clarify previous imaging work identifying cortical atrophy in a mixed SLE and NPSLE group, and suggest that neuroanatomical abnormalities are specific to SLE patients diagnosed with neuropsychiatric symptoms. Future work should help elucidate the underlying mechanisms underlying the emerging neurobiological profile seen in NPSLE, as well as clarify the apparent lack of overlap between cortical thinning and functional activation results and other findings pointing to increased functional activation during cognitive tasks.
Conflict of interest statement
Figures
Similar articles
-
Brain morphology and cortical thickness variations in systemic lupus erythematosus patients: Differences among neurological, psychiatric, and nonneuropsychiatric manifestations.J Magn Reson Imaging. 2017 Jul;46(1):150-158. doi: 10.1002/jmri.25538. Epub 2016 Nov 8. J Magn Reson Imaging. 2017. PMID: 27862544
-
Evaluation of MRI-based brain oxygen extraction fraction mapping in patients with systemic lupus erythematosus.Lupus Sci Med. 2025 Jun 16;12(1):e001522. doi: 10.1136/lupus-2025-001522. Lupus Sci Med. 2025. PMID: 40527524 Free PMC article.
-
Distinct regional brain atrophy pattern in multiple sclerosis and neuropsychiatric systemic lupus erythematosus patients.Lupus. 2018 Sep;27(10):1624-1635. doi: 10.1177/0961203318781004. Epub 2018 Jun 27. Lupus. 2018. PMID: 29950159
-
Quantitative magnetic resonance imaging in neuropsychiatric systemic lupus erythematosus.Lupus. 2003;12(12):897-902. doi: 10.1191/0961203303lu499oa. Lupus. 2003. PMID: 14714908 Review.
-
Advanced neuroimaging in neuropsychiatric systemic lupus erythematosus.Curr Opin Neurol. 2020 Jun;33(3):353-361. doi: 10.1097/WCO.0000000000000822. Curr Opin Neurol. 2020. PMID: 32349105 Free PMC article. Review.
Cited by
-
Abnormal topological organization in systemic lupus erythematosus: a resting-state functional magnetic resonance imaging analysis.Brain Imaging Behav. 2021 Feb;15(1):14-24. doi: 10.1007/s11682-019-00228-y. Brain Imaging Behav. 2021. PMID: 31903526
-
Structural and Functional Characterization of Gray Matter Alterations in Female Patients With Neuropsychiatric Systemic Lupus.Front Neurosci. 2022 May 2;16:839194. doi: 10.3389/fnins.2022.839194. eCollection 2022. Front Neurosci. 2022. PMID: 35585919 Free PMC article.
-
The impact of disease activity and interferon-α on the nervous system in systemic lupus erythematosus.Arthritis Res Ther. 2025 Mar 20;27(1):60. doi: 10.1186/s13075-025-03539-2. Arthritis Res Ther. 2025. PMID: 40114276 Free PMC article.
-
The structure of creative cognition in the human brain.Front Hum Neurosci. 2013 Jul 8;7:330. doi: 10.3389/fnhum.2013.00330. eCollection 2013. Front Hum Neurosci. 2013. PMID: 23847503 Free PMC article.
-
Prefrontal cortical deficits in type 1 diabetes mellitus: brain correlates of comorbid depression.Arch Gen Psychiatry. 2012 Dec;69(12):1267-76. doi: 10.1001/archgenpsychiatry.2012.543. Arch Gen Psychiatry. 2012. PMID: 23090665 Free PMC article.
References
-
- Feely RH. The neuropsychiatric features of systemic lupus erythematosus. Ir Med J. 1976;69:255–256. - PubMed
-
- Feinglass EJ, Arnett FC, Dorsch CA, Zizic TM, Stevens MB. Neuropsychiatric manifestations of systemic lupus erythematosus: diagnosis, clinical spectrum, and relationship to other features of the disease. Medicine (Baltimore) 1976;55:323–339. - PubMed
-
- Bluestein HG. Neuropsychiatric manifestations of systemic lupus erythematosus. N Engl J Med. 1987;317:309–311. - PubMed
-
- The American College of Rheumatology nomenclature and case definitions for neuropsychiatric lupus syndromes. Arthritis Rheum. 1999;42:599–608. - PubMed
Publication types
MeSH terms
Grants and funding
LinkOut - more resources
Full Text Sources
