. 2010 Mar 23;5(3):e9806.
doi: 10.1371/journal.pone.0009806.

Nucleocytoplasmic distribution and dynamics of the autophagosome marker EGFP-LC3

Affiliations

Nucleocytoplasmic distribution and dynamics of the autophagosome marker EGFP-LC3

Kimberly R Drake et al. PLoS One. .

Abstract

The process of autophagy involves the formation of autophagosomes, double-membrane structures that encapsulate cytosol. Microtubule-associated protein light chain 3 (LC3) was the first protein shown to specifically label autophagosomal membranes in mammalian cells, and subsequently EGFP-LC3 has become one of the most widely utilized reporters of autophagy. Although LC3 is currently thought to function primarily in the cytosol, the site of autophagosome formation, EGFP-LC3 often appears to be enriched in the nucleoplasm relative to the cytoplasm in published fluorescence images. However, the nuclear pool of EGFP-LC3 has not been specifically studied in previous reports, and mechanisms by which LC3 shuttles between the cytoplasm and nucleoplasm are currently unknown. In this study, we therefore investigated the regulation of the nucleo-cytoplasmic distribution of EGFP-LC3 in living cells. By quantitative fluorescence microscopy analysis, we demonstrate that soluble EGFP-LC3 is indeed enriched in the nucleus relative to the cytoplasm in two commonly studied cell lines, COS-7 and HeLa. Although LC3 contains a putative nuclear export signal (NES), inhibition of active nuclear export or mutation of the NES had no effect on the nucleo-cytoplasmic distribution of EGFP-LC3. Furthermore, FRAP analysis indicates that EGFP-LC3 undergoes limited passive nucleo-cytoplasmic transport under steady state conditions, and that the diffusional mobility of EGFP-LC3 was substantially slower in the nucleus and cytoplasm than predicted for a freely diffusing monomer. Induction of autophagy led to a visible decrease in levels of soluble EGFP-LC3 relative to autophagosome-bound protein, but had only modest effects on the nucleo-cytoplasmic ratio or diffusional mobility of the remaining soluble pools of EGFP-LC3. We conclude that the enrichment of soluble EGFP-LC3 in the nucleus is maintained independently of active nuclear export or induction of autophagy. Instead, incorporation of soluble EGFP-LC3 into large macromolecular complexes within both the cytoplasm and nucleus may prevent its rapid equilibrium between the two compartments.


Conflict of interest statement

Competing Interests: The authors have declared that no competing interests exist.

Figures

Figure 1
Figure 1. EGFP-LC3 and tfLC3 are selectively enriched in the nucleus under steady state conditions.
(A) Localization of EGFP, EGFP-LC3, and tfLC3 under steady state conditions in transiently transfected COS-7 cells. (B) Quantification of N/C ratios for EGFP, EGFP-LC3, and tfLC3 under steady state conditions was performed as described in the Materials and Methods. Data show the mean ± SD for 40–60 cells from a total of 4–5 independent experiments for each protein. **, p<.0001 compared to EGFP by Student t-test. (C) Distribution of EGFP-LC3 in stably transfected HeLa cells. (D) (Left) Subcellular distribution of EGFP-LC3 versus EGFP-LC3G120A in COS-7 cells. (Right) Mean N/C ratios were measured for 58-79 cells from 4 independent experiments. (E) (Left) Localization of mStrawberry-Atg4BC74A versus EGFP-LC3 when expressed individually in COS-7 cells. (Right) Mean N/C ratios were obtained from 56–61 cells from 3 independent experiments. **, p<.0001 compared to mStrawberry-Atg4BC74A by Student t-test. (F) Localization of mStrawberry-Atg4BC74A (red in merged image) and EGFP-LC3 (green in merged image) following their coexpression in COS-7 cells. All scale bars  = 10 µm.
Figure 2
Figure 2. LC3 contains a putative NES, but remains enriched in the nucleus following blockade of nuclear export or mutation of the NES.
(A) Sequence of human LC3. The predicted leucine-rich nuclear export signal is underlined. (B) Effect of LMB, a specific inhibitor of nuclear export, on the distribution of EGFP-LC3 or Rev(68–90)GFP2-cNLS. COS-7 cells expressing EGFP-LC3 or Rev(68–90)GFP2-cNLS were treated with 20 nM LMB for 3 h at 37°C. The cells were then shifted onto the microscope stage for imaging. Scale bar  = 10 µm. (C) Quantification of the mean intensity of EGFP-LC3 and Rev(68–90)GFP2-cNLS in the nucleoplasm versus the cytoplasm of COS-7 cells under control conditions and following LMB treatment. Data show the mean ± SD for 20 cells from 2 independent experiments. **, p<.0001 compared to control by Student t-test. (D) Distribution of EGFP-LC3 in stably transfected HeLa cells following treatment with 20 nM LMB or vehicle for 3 h at 37°C. Scale bar  = 10 µm. (E) Distribution of EGFP-LC3 mNES mutant in COS-7 cells. Representative images showing the two major phenotypes observed are shown. Scale bars  = 10 µm.
Figure 3
Figure 3. The nucleocytoplasmic distribution of EGFP-LC3 is modestly affected by microtubule disruption.
Cells were subjected to microtubule disruption with 5 µg/ml NZ or mock-treated (“control”) and fixed prior to imaging as described in the Materials and Methods. (A) Effect of NZ on the distribution of EGFP-LC3 in COS-7 cells. (B) Quantification of N/C for soluble EGFP-LC3 in mock-treated or NZ-treated COS-7 cells. Data show the mean ± SD for 28–30 cells from 2 independent experiments. (C) Effect of NZ on the distribution of GFP-LC3 in HeLa cells. (D) As in B except data are for EGFP-LC3 in HeLa cells. Data show the mean ± SD for 62–72 cells from 2 independent experiments. Scale bar  = 10 µm.
Figure 4
Figure 4. The kinetics of nuclear import and export of EGFP-LC3 and tfLC3 are significantly slower that that of EGFP as assessed by photobleaching.
Photobleaching experiments of the entire nucleus or entire cytoplasm were performed at 37°C. (A) Images from a representative nuclear photobleaching experiment measuring the kinetics of nuclear import of EGFP-LC3, tfLC3, and EGFP in COS-7 cells. (B) As in A, except the cytoplasmic pool of proteins were photobleached. (C) Images from a representative nuclear photobleaching experiment of EGFP-LC3 in HeLa cells. Bars, 10 µm.
Figure 5
Figure 5. EGFP-LC3 and tfLC3 diffuse more slowly than predicted by their molecular weights.
COS-7 cells were transfected with the indicated constructs. The following day, confocal FRAP experiments were performed at 37°C as described in the Materials and Methods. (A) Representative images collected during a FRAP experiment in COS-7 cells. Data are shown for measurements in the nucleus. Scale bar  = 2 µm. (B) Recovery curves for EGFP (black circles), EGFP-LC3 (blue squares), and tfLC3 (red triangles) in the cytoplasm of COS-7 cells. Data show the mean values for 10 cells from a representative experiment. For clarity, error bars are not shown. (C) Recovery curves for EGFP (black circles), EGFP-LC3 (blue squares), and p53-GFP (green crosses) in the nucleus of COS-7 cells. Data show the mean ± SE for 10 cells from a representative experiment. For clarity, error bars are not shown. (D) Effective diffusion coefficients for EGFP, EGFP-LC3, tfLC3, and p53-GFP in the cytosol (white bars) and nucleus (gray bars) of COS-7 cells. Data show the mean ± SD for 30 cells from a total of 3 independent experiments. (E) Mobile fractions for EGFP, EGFP-LC3, tfLC3, and p53-GFP in the cytosol (white bars) and nucleus (gray bars) of COS-7 cells. Data show the mean ± SD for 30 cells from a total of 3 independent experiments.
Figure 6
Figure 6. Effect of amino acid starvation on the nuclear/cytoplasmic ratio and diffusional mobility of EGFP-LC3.
(A) Effect of amino acid starvation on the subcellular localization of EGFP-LC3, tfLC3, and EGFP in live COS-7 cells. Bar, 10 µm. (B) Quantification of the mean intensity of EGFP, EGFP-LC3, and tfLC3 in the nucleoplasm versus the cytoplasm under control conditions and following amino acid starvation in COS-7 cells. Data show the mean ± SD for 20-30 cells from 2–3 independent experiments for each protein. (C) Representative FRAP curve for EGFP-LC3 in the cytoplasm or nucleus of untreated COS-7 cells (“control”, open squares) and COS-7 cells incubated for 5 h in EBSS (“starved”, closed circles). FRAP experiments were performed as described in the Materials and Methods. Data show the mean± SD for 8–10 cells from a representative experiment. For clarity, error bars are only shown for every third datapoint after the bleach. (D) Effect of amino acid starvation on the localization of EGFP-LC3 in live HeLa cells. Bar, 10 µm. (E) Quantification of the N/C ratio of EGFP-LC3 under control conditions and following amino acid starvation in live HeLa cells. Data show the mean ± SD for 81–117 cells from 3 independent experiments. (F) Effective diffusion coefficients for nuclear EGFP-LC3 in HeLa cells under control conditions or following amino acid starvation. Data show the mean ± SD for 20–30 cells from 3 independent experiments. *, p<.01 compared to control, and **, p<.0006 compared to control by Student t-test.
Figure 7
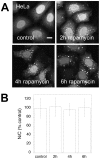
Figure 7. Effect of rapamycin on the nucleo-cytoplasmic distribution of EGFP-LC3.
(A) Effect of rapamycin treatment or incubation with vehicle (control) on the distribution of EGFP-LC3 in fixed HeLa cells. Bar, 10 µm. (B) Quantification of the N/C ratio of EGFP-LC3 following rapamycin treatment versus treatment with vehicle (control) in fixed HeLa cells. To correct for differences in basal N/C values across experiments, data for rapamycin treated cells were normalized to control values for a given experiment. Data represent the mean ± SD for 98–113 cells from 3 independent experiments.
Figure 8
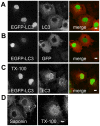
Figure 8. Detection of exogenous and endogenous LC3 in the nucleoplasm by immunostaining.
(A) COS-7 cells expressing EGFP-LC3 were fixed in 3.7% PFA, permeabilized with 0.1% saponin, and processed for immunostaining for LC3 as described in the Materials and Methods. In the merged images, GFP fluorescence is shown in green and antibody staining in red. (B) As in (A), except cells were labeled with an anti-GFP antibody. (C) COS-7 cells expressing EGFP-LC3 were fixed in PFA and permeabilized with TX-100, and stained for LC3 as described in the Materials and Methods. In the merged images, GFP fluorescence is shown in green and antibody staining in red. (D) Untransfected COS-7 cells were fixed and permeabilized using saponin or TX-100 as described in the Materials and Methods and then immunostained for endogenous LC3. Bars, 10 µm.

References

    1. Klionsky DJ, Emr SD. Autophagy as a regulated pathway of cellular degradation. Science. 2000;290:1717–1721. - PMC - PubMed
    1. Eskelinen EL. Maturation of autophagic vacuoles in mammalian cells. Autophagy. 2005;1:1–10. - PubMed
    1. Kabeya Y, Mizushima N, Ueno T, Yamamoto A, Kirisako T, et al. LC3, a mammalian homologue of yeast Apg8p, is localized in autophagosome membranes after processing. Embo J. 2000;19:5720–5728. - PMC - PubMed
    1. Klionsky DJ, Abeliovich H, Agostinis P, Agrawal DK, Aliev G, et al. Guidelines for the use and interpretation of assays for monitoring autophagy in higher eukaryotes. Autophagy. 2008;4:151–175. - PMC - PubMed
    1. Tanida I, Ueno T, Kominami E. LC3 and Autophagy. Methods Mol Biol. 2008;445:77–88. - PubMed

Publication types

Substances