. 2010 Mar 23;5(3):e9823.
doi: 10.1371/journal.pone.0009823.

Sensitive detection of gene expression in mycobacteria under replicating and non-replicating conditions using optimized far-red reporters

Affiliations

Sensitive detection of gene expression in mycobacteria under replicating and non-replicating conditions using optimized far-red reporters

Paul Carroll et al. PLoS One. .

Abstract

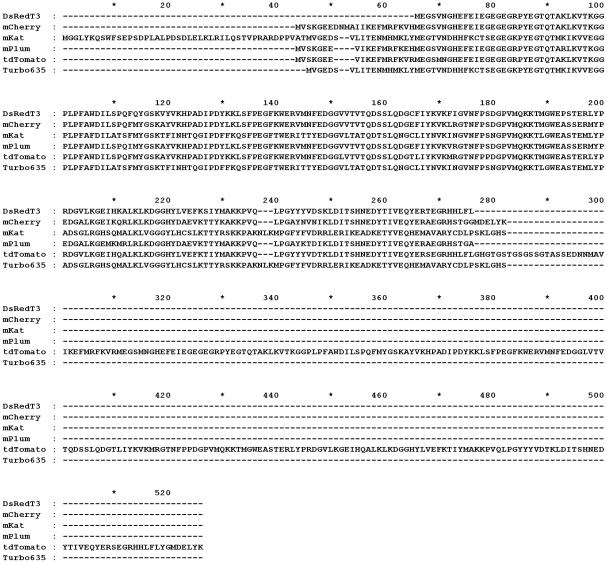
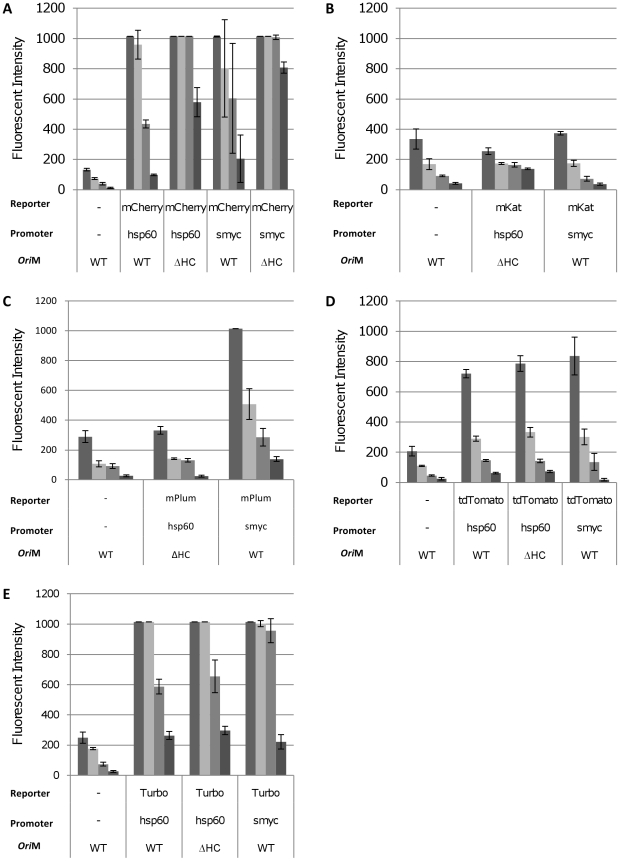
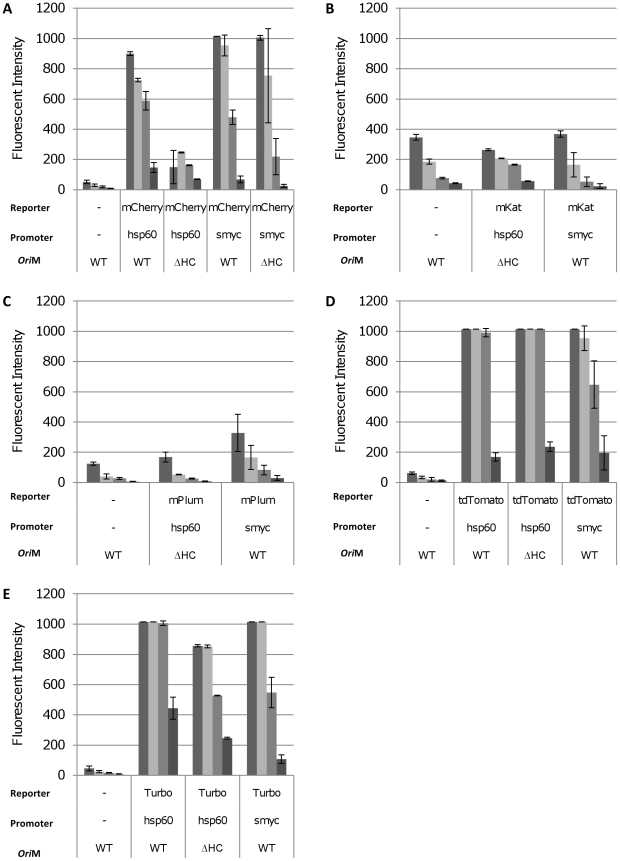
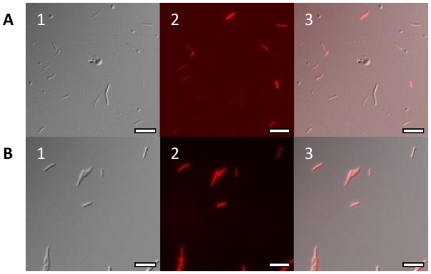
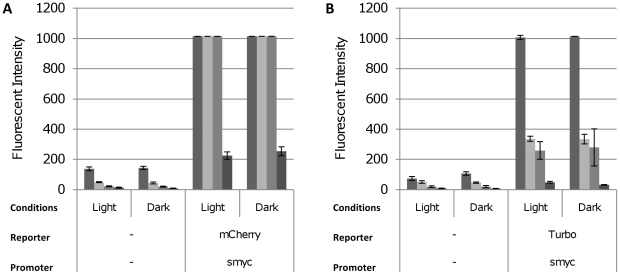
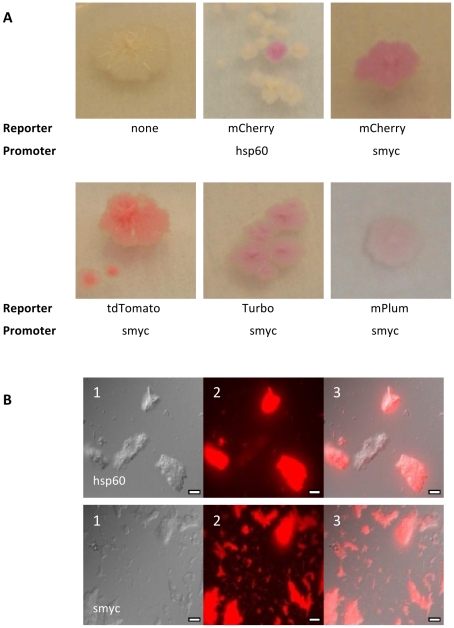
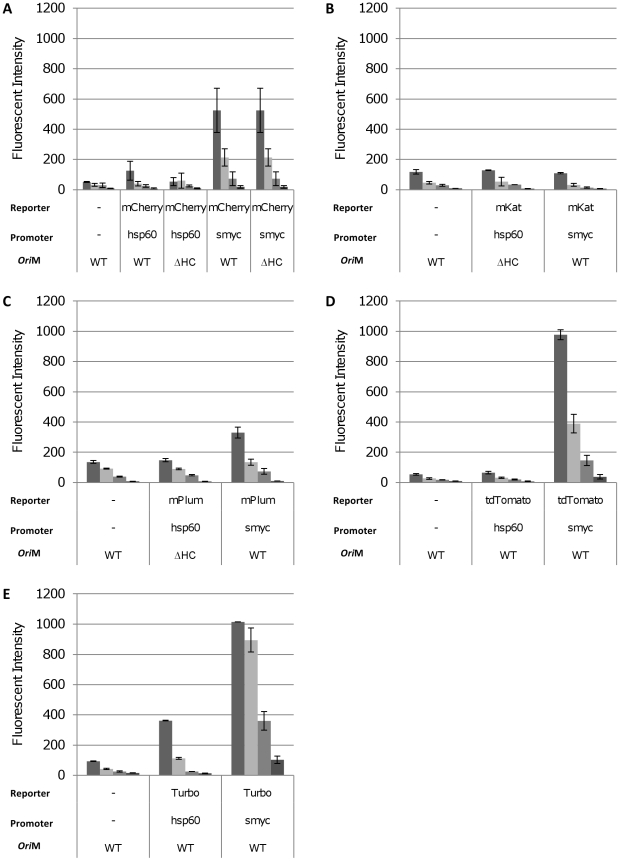
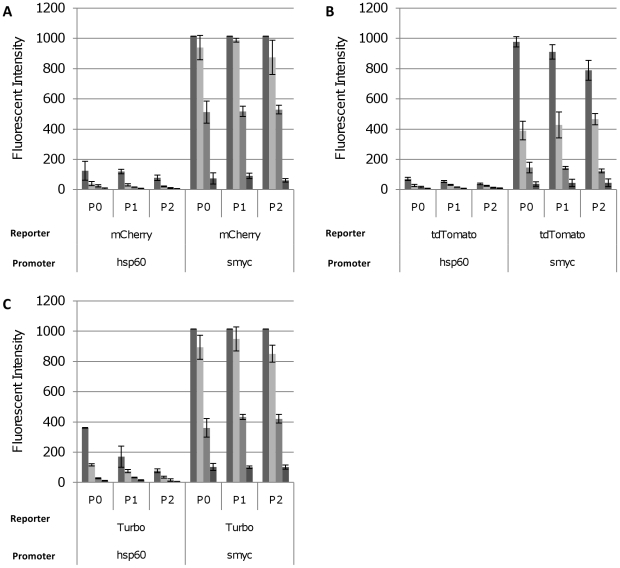
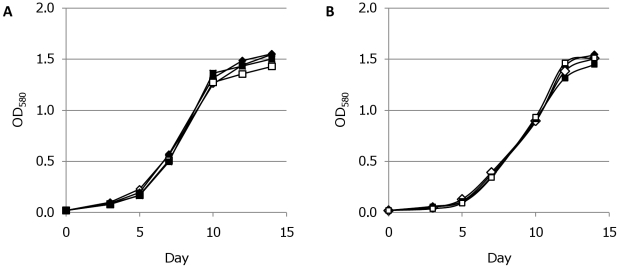
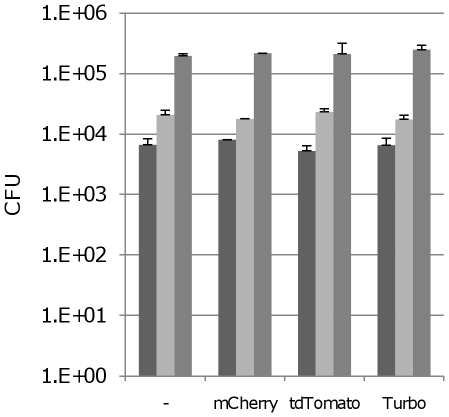
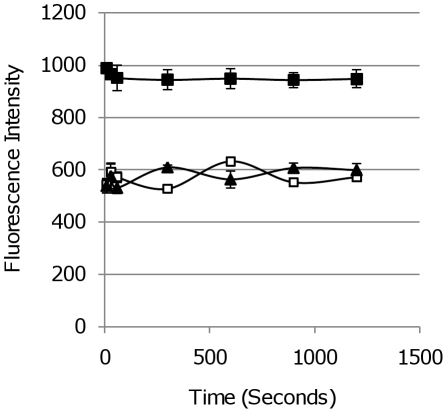
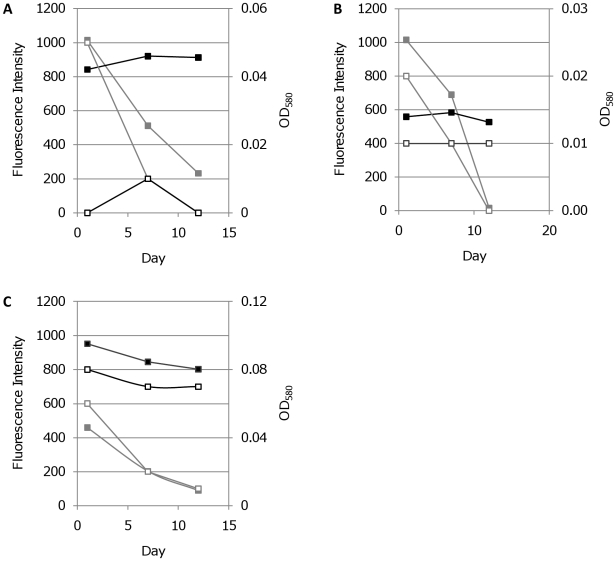
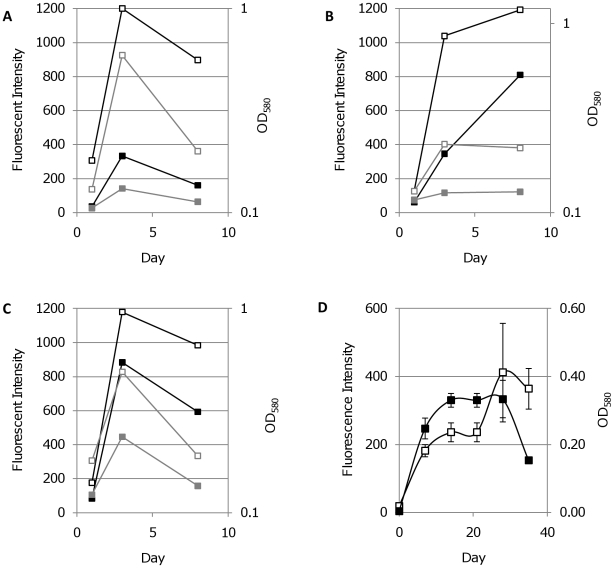
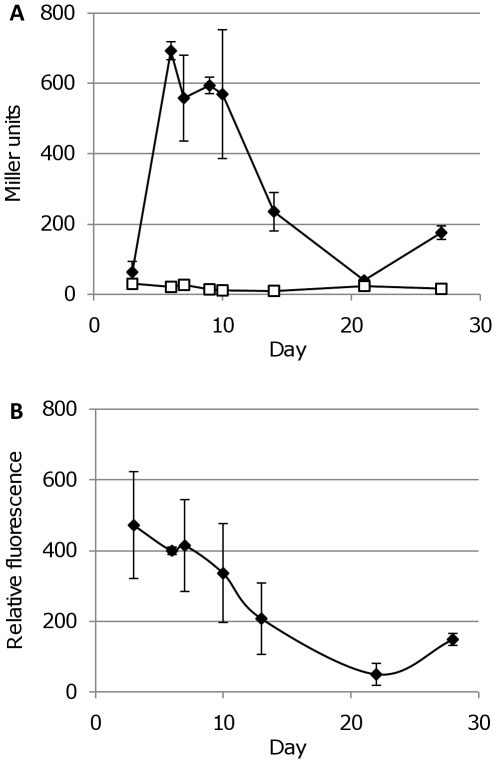
Fluorescent reporter proteins have proven useful for imaging techniques in many organisms. We constructed optimized expression systems for several fluorescent proteins from the far-red region of the spectrum and analyzed their utility in several mycobacterial species. Plasmids expressing variants of the Discosoma Red fluorescent protein (DsRed) from the Mycobacterium bovis hsp60 promoter were unstable; in contrast expression from the Mycobacterium smegmatis rpsA promoter was stable. In Mycobacterium tuberculosis expression of several of the far-red reporters was readily visualised by eye and three reporters (mCherry, tdTomato, and Turbo-635) fluoresced at a high intensity. Strains expressing mCherry showed no fitness defects in vitro or in macrophages. Treatment of cells with antibiotics demonstrated that mCherry could also be used as a reporter for cell death, since fluorescence decreased in the presence of a bactericidal compound, but remained stable in the presence of a bacteriostatic compound. mCherry was functional under hypoxic conditions; using mCherry we demonstrated that the P(mtbB) is expressed early in hypoxia and progressively down-regulated. mCherry and other far-red fluorescent proteins will have multiple uses in investigating the biology of mycobacteria, particularly under non-replicating, or low cell density conditions, as well as providing a novel means of detecting cell death rapidly.


Conflict of interest statement

Competing Interests: The authors have declared that no competing interests exist.

Figures

Figure 1
Figure 1. Amino-acid alignment of the far-red fluorescent proteins used in this study with DsRed.
mCherry, mPlum, mKat and Turbo635 are all expressed as monomers, tdTomato is expressed as a tandem dimer. Identical residues are marked with *, similar residues are marked with : and .
Figure 2
Figure 2. Detection of fluorescent reporters in E. coli DH5α.
E. coli transformants were cultured and diluted (from left to right) to an OD580 of 0.25, 0.10, 0.05 and 0.01, representing cell densities of 5.5×10⁶, 1.5×10⁶, 7.7×10⁵ and 1.1.×105 per mL respectively. Fluorescence was quantified at the following wavelengths: mCherry 587/610 nm, mKat 588/635 nm, mPlum 590/649 nm, tdTomato 554/581 nm, Turbo-635 588/635 nm. Data are the averages and standard deviations from three independent transformants. A value of 1015 corresponds to saturation of the machine. The reporter, promoter and vector backbone are indicated. WT = wild-type oriM; ΔHC – high copy number derivative oriM.
Figure 3
Figure 3. Far-red fluorescent reporters are functional in M. smegmatis mc2155.
Fluorescent reporters were expressed from Phps60 or Psmyc in M. smegmatis and assayed in liquid culture. Cultures were diluted (from left to right) to an OD580 of 0.25, 0.10, 0.05 and 0.01, representing cell densities of 7.8×10⁷, 2.3×10⁷, 9.2×10⁶ and 1.8×10⁶ per mL respectively. Fluorescence was quantified at the following wavelengths: mCherry 587/610 nm, mKat 588/635 nm, mPlum 590/649 nm, tdTomato 554/581 nm, Turbo-635 588/635 nm. Data are the mean and standard deviation from three independent transformants. A value of 1015 corresponds to saturation of the machine. The reporter, promoter and vector backbone are indicated. WT = wild-type oriM; ΔHC – high copy number derivative oriM.
Figure 4
Figure 4. Microscopy of M. smegmatis mc2155 strains expressing mCherry.
M. smegmatis transformants were grown in liquid for microscopy. Cells were visualised by differential interference contrast and fluorescence microscopy. Panel A - transformants carrying Phsp60-mCherry. Panel B - transformants carrying Psmyc-mCherry. 1 - Differential interference contrast; 2 - Texas Red filter; 3 - overlaid image. Scale bar is equal to 10 µm.
Figure 5
Figure 5. Far-red fluorescent reporters are functional in M. marinum strain M.
Fluorescent reporters were expressed from Psmyc in M. marinum and assayed in liquid culture grown either in the dark or in the light. Cultures were diluted (from left to right) to an OD580 of 0.25, 0.10, 0.05 and 0.01, representing cell densities of 9.8×10⁵, 4.2×10⁵, 1.9×10⁵ and 6.5×10⁴ CFU/ml respectively. Fluorescence was quantified at the following wavelengths: mCherry 587/610 nm, Turbo-635 588/635 nm. Data are the mean and standard deviation from three independent transformants. A value of 1015 corresponds to saturation of the machine. The reporter and promoter backbone are indicated.
Figure 6
Figure 6. Detection of fluorescent reporter in M. tuberculosis H37Rv.
FP expression plasmids were transformed into M. tuberculosis and colonies isolated on hygromycin-containing plates. (A) Expression of several fluorescent reporters gave rise to coloured colonies. (B) Microscopy of fluorescent mCherry reporter driven by either Phsp60 or Psmyc. Scale bar is equal to 10 µm.
Figure 7
Figure 7. Detection of fluorescent reporters in liquid cultures of M. tuberculosis H37Rv.
Fluorescent reporters were expressed from Phps60 or Psmyc in M. tuberculosis and assayed in liquid culture. Cultures were diluted (from left to right) to an OD580 of 0.25, 0.10, 0.05 and 0.01, representing cell densities of 4.8×10⁷, 1.7×10⁷, 9.1×10⁶ and 1.7×10⁶ CFU/ml respectively. Fluorescence was quantified at the following wavelengths: mCherry 587/610 nm, mKat 588/635 nm, mPlum 590/649 nm, tdTomato 554/581 nm, Turbo-635 588/635 nm. Data are the mean and standard deviation from three independent transformants. A value of 1015 corresponds to saturation of the machine. The reporter, promoter and vector backbone are indicated. WT = wild-type oriM; ΔHC – high copy number derivative oriM.
Figure 8
Figure 8. Expression of fluorescent proteins in M. tuberculosis H37Rv is stably maintained.
Transformants were grown in liquid medium and passaged every 5 days into fresh medium. Fluorescence was quantified at wavelengths associated with optimum reporter expression and emission at cultures normalised to OD580 of 0.25, 0.10, 0.05 and 0.01 (from left to right). Fluorescence was quantified at the following wavelengths: mCherry 587/610 nm, tdTomato 554/581 nm, Turbo-635 588/635 nm. Data are the averages and standard deviations from three independent transformants. A value of 1015 corresponds to saturation of the machine. The reporter, promoter and vector backbone are indicated. P0 = initial culture; P1 = passage 1; P2 = passage 2.
Figure 9
Figure 9. Growth kinetics of M. tuberculosis reporter strains.
M. tuberculosis transformants were grown in liquid medium in the (A) presence or (B) absence of hygromycin. ◊ pSMT3 empty vector control; □ tdTomato expressed from Psmyc; Δ Turbo expressed from Psmyc; ▪ mCherry expressed from Phsp60 and ♦ mCherry expressed from Psmyc. Data are the averages from three independent transformants.
Figure 10
Figure 10. Virulence of M. tuberculosis fluorescent strains in murine macrophages.
Murine macrophages were infected at an MOI of 1∶1 with recombinant strains expressing the indicated reporter from Psmyc. Bacterial counts were measured over a period of 7 days. Data are the mean and standard deviation from three independent infections. Time points for each reporter strain, from left to right are day 1, day 3 and day 7.
Figure 11
Figure 11. Stability of M. tuberculosis fluorescent strains after long-term excitation.
M. tuberculosis transformants expressing FPs from Psmyc were grown in liquid medium and the OD580 adjusted to 0.01. Fluorescence was quantified after excitation over a period of 20 min. (▴) mCherry, (▪)Turbo-635 and (□) tdTomato.
Figure 12
Figure 12. Correlation between cell viability and fluorescence in M. tuberculosis during antibiotic treatment.
Transformants expressing FPs from Psmyc were grown in liquid and treated with the bactericidal antibiotic kanamycin (grey line) or the static antibiotic chloramphenicol (black line). Fluorescence intensity (solid squares) and OD580 (open squares) were measured. A. mCherry, B. tdTomato and C. Turbo-635.
Figure 13
Figure 13. FP activity under hypoxic conditions.
M. smegmatis (A to C) transformants expressing FPs from Psmyc were cultured aerobically (black lines) or under limiting oxygen (grey lines) conditions. Fluorescence intensity (solid squares) and OD580 (open squares) were measured. A - M. smegmatis expressing mCherry. B -M. smegmatis expressing tdTomato. C - M. smegmatis expressing Turbo-635. D - M. tuberculosis expressing mCherry under hypoxic conditions. M. tuberculosis transformants expressing FPs from Psmyc were cultured under limiting oxygen conditions. Fluorescence intensity (open squares) and OD580 (solid squares) were measured.
Figure 14
Figure 14. M. tuberculosis PmbtB activity during hypoxic culture.
Promoter activity was assayed in the hypoxia model using (A) LacZ and (B) mCherry as a reporter. Activity of LacZ is reported in Miller units (units activity per mg total protein in cell-free extracts). Activity from mCherry is reported in relative fluorescence units (fluorescence after background subtraction per OD580 in whole cells). (A) ▪ PmbtB activity; □ control vector pSM128 activity. (B) ♦ PmbtB activity.

Similar articles

Cited by

References

    1. Coons AH, Creech HJ, Jones RN, Berliner E. The demonstration of pneumococcal antigen in tissues by the use of fluorescent antibody. J Immunol. 1942;45:159–170.
    1. Chalfie M, Tu Y, Euskirchen G, Ward WW, Prasher DC. Green fluorescent protein as a marker for gene expression. Science. 1994;263:802–805. - PubMed
    1. Carroll P, James J. Assaying promoter activity using LacZ and GFP as reporters. In: Parish T, Brown AC, editors. Mycobacteria Protocols: Humana Press; 2009. pp. 265–278. - PubMed
    1. Dhandayuthapani S, Via LE, Thomas CA, Horowitz PM, Deretic D, et al. Green fluorescent protein as a marker for gene expression and cell biology of mycobacterial interactions with macrophages. Mol Microbiol. 1995;17:901–912. - PubMed
    1. McKinney JD, Honer zu Bentrup K, Munoz-Elias EJ, Miczak A, Chen B, et al. Persistence of Mycobacterium tuberculosis in macrophages and mice requires the glyoxylate shunt enzyme isocitrate lyase. Nature. 2000;406:735–738. - PubMed

Publication types