. 2010 Nov;15(6):1027-38.
doi: 10.1007/s12192-010-0189-7. Epub 2010 Mar 30.

Identification of microRNAs associated with hyperthermia-induced cellular stress response

Affiliations

Identification of microRNAs associated with hyperthermia-induced cellular stress response

Gerald J Wilmink et al. Cell Stress Chaperones. 2010 Nov.

Abstract

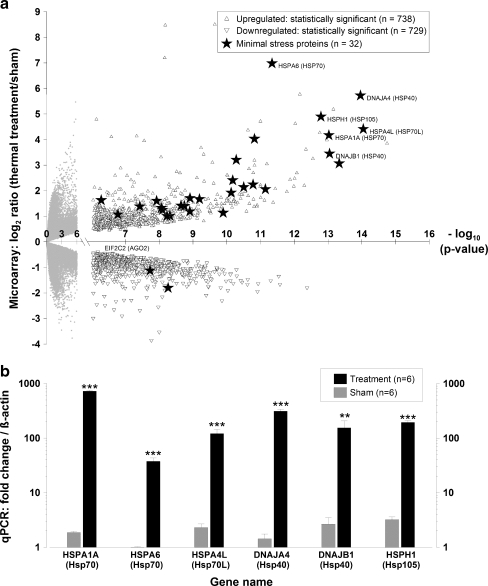
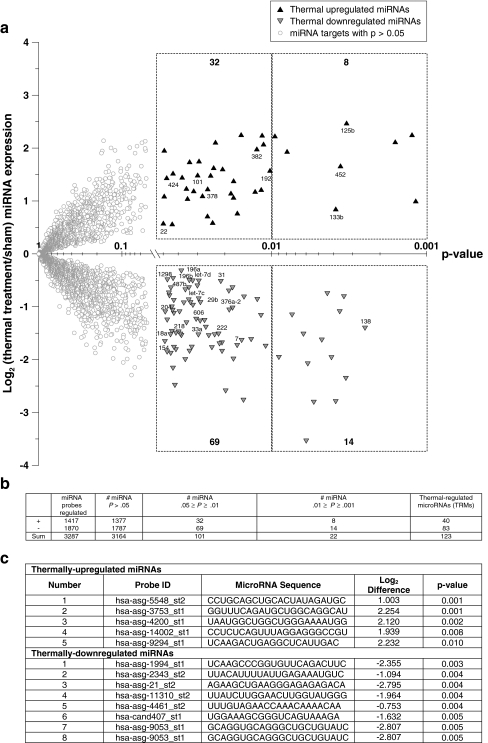
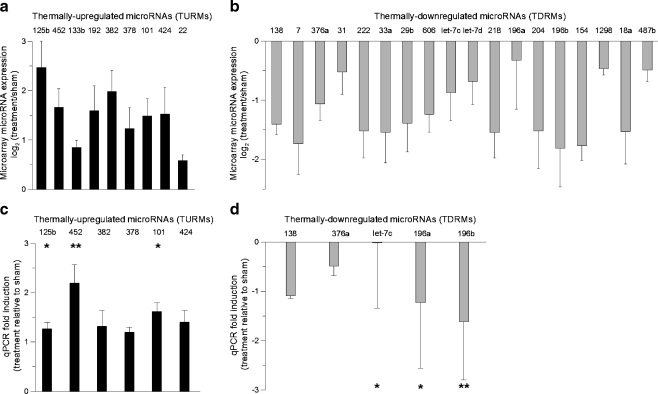
MicroRNAs (miRNAs) are a class of small RNAs that play a critical role in the coordination of fundamental cellular processes. Recent studies suggest that miRNAs participate in the cellular stress response (CSR), but their specific involvement remains unclear. In this study, we identify a group of thermally regulated miRNAs (TRMs) that are associated with the CSR. Using miRNA microarrays, we show that dermal fibroblasts differentially express 123 miRNAs when exposed to hyperthermia. Interestingly, only 27 of these miRNAs are annotated in the current Sanger registry. We validated the expression of the annotated miRNAs using qPCR techniques, and we found that the qPCR and microarray data was in well agreement. Computational target-prediction studies revealed that putative targets for the TRMs are heat shock proteins and Argonaute-2-the core functional unit of RNA silencing. These results indicate that cells express a specific group of miRNAs when exposed to hyperthermia, and these miRNAs may function in the regulation of the CSR. Future studies will be conducted to determine if other cells lines differentially express these miRNAs when exposed to hyperthermia.


Figures

Fig. 1
Fig. 1
Hyperthermia stress protocol induces an appreciable cellular stress response as evidenced by the marked up-regulation of minimal stress proteins. Dermal fibroblasts were exposed to a hyperthermia protocol (44°C for 40 min), and RNA was extracted 4 h post-exposure. Microarrays and qPCR analyses were conducted for control and treatment groups with n = 6 for each group. a Volcano plot of mRNA microarray data, where the magnitude of the expression is plotted versus the level of statistical significance. Statistical significant genes were identified using Bonferroni correction procedures with a cutoff of −log10p > 6.04. Statistically insignificant targets (empty circles), significant targets (triangles), significant minimal stress proteins (filled stars). Data are expressed as means. b Gene expression for minimal stress proteins (HSPA1A, HSPA6, HSPA4L, DNAJA4, DNAJB1, and HSPH1) using qRT-PCR. The mRNA expression fold values formula image were measured for sham and treatment groups with n = 6 for each group. Values were calculated in relation to β-actin and normalized to a separate RNA calibrator. Sham (gray bar), treatment (black bar). Data are expressed as means ± SD; ***p < 10−5, **p < 10−3; between indicated groups
Fig. 2
Fig. 2
Identification of miRNAs associated with hyperthermia-induced CSR. Dermal fibroblasts were exposed to a hyperthermia protocol (44°C for 40 min), and RNA was extracted 4 h post-exposure. MicroRNA microarrays were conducted for control and treatment groups with n = 6 for each group. a Volcano plot of miRNA microarray data. The signal difference (log2) is plotted versus the level of statistical significance (p value). Statistically insignificant targets (empty circles), significant up-regulated targets (black triangles), significant down-regulated targets (gray triangles). Data are expressed as means. miRNA targets with published names are provided below each data point. The nonsymmetrical distribution of data points suggests that cells exposed to hyperthermia stress exhibit an overall decrease in miRNA expression. b Summary table for miRNA microarray data. A total of 123 miRNA targets have p values <0.05. These targets are referred to as thermally regulated microRNAs (TRMs). c List of miRNA probes exhibiting the greatest level of differential expression by miRNA microarray analysis. None of these miRNAs are currently annotated in the Sanger Registry
Fig. 3
Fig. 3
Quantification of microarray data and qPCR validation of annotated thermally regulated microRNAs (TRMs). a–b miRNA microarray expression data for thermally up-regulated and thermally down-regulated miRNAs (mean ± SD, n = 6). For both plots, the mean log2 fold change between the treatment and sham groups is plotted for each miRNA. c–d Taqman qRT-PCR validation of thermally regulated miRNA targets. Fold-changes (treatment relative to sham) were calculated using the formula image method. Values were calculated against designated calibrators and were normalized to RNU48—endogenous control. TURMs (black bar), TDRMs (gray bar). Data are expressed as means ± SD; *p < 0.05, **p < 0.01; between indicated groups

References

    1. Ambros V. microRNAs: tiny regulators with great potential. Cell. 2001;107(7):823–826. doi: 10.1016/S0092-8674(01)00616-X. - DOI - PubMed
    1. Babar IA, Slack FJ, et al. miRNA modulation of the cellular stress response. Future Oncol. 2008;4(2):289–298. doi: 10.2217/14796694.4.2.289. - DOI - PubMed
    1. Bartel DP. MicroRNAs: genomics, biogenesis, mechanism, and function. Cell. 2004;116(2):281–297. doi: 10.1016/S0092-8674(04)00045-5. - DOI - PubMed
    1. Benjamini Y, Drai D, et al. Controlling the false discovery rate in behavior genetics research. Behav Brain Res. 2001;125(1–2):279–284. doi: 10.1016/S0166-4328(01)00297-2. - DOI - PubMed
    1. Bentwich I, Avniel A, et al. Identification of hundreds of conserved and nonconserved human microRNAs. Nat Genet. 2005;37(7):766–770. doi: 10.1038/ng1590. - DOI - PubMed

Publication types

MeSH terms