

Review
doi: 10.1021/cr900300p.
Imaging and photodynamic therapy: mechanisms, monitoring, and optimization
Affiliations
- PMID: 20353192
- PMCID: PMC2896821
- DOI: 10.1021/cr900300p
Item in Clipboard
Review
Imaging and photodynamic therapy: mechanisms, monitoring, and optimization
Chem Rev.
.
No abstract available
Figures
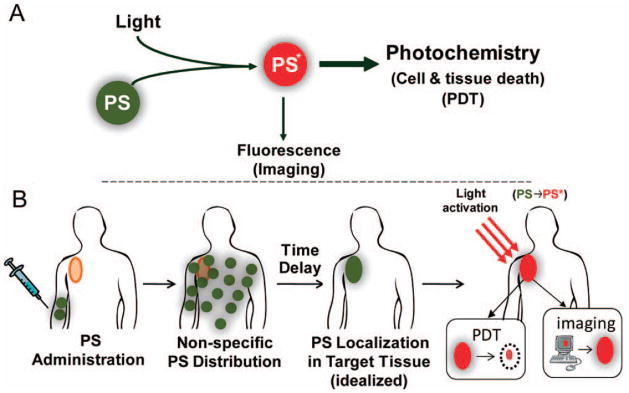
(A) A schematic representation of PDT where PS is a photoactivatable
multifunctional agent, which, upon light activation can serve as both an
imaging agent and a therapeutic agent. (B) A schematic representation of the
sequence of administration, localization and light activation of the PS for
PDT or fluorescence imaging. Typically the PS is delivered systemically and
allowed to circulate for an appropriate time interval (the
“drug-light interval”), during which the PS accumulates
preferentially in the target lesion(s) prior to light activation. In the
idealized depiction here the PS is accumulation is shown to be entirely in
the target tissue, however, even if this is not the case, light delivery
confers a second layer of selectivity so that the cytotoxic effect will be
generated only in regions where both drug and light are present. Upon
localization of the PS, light activation will result in fluorescence
emission which can be implemented for imaging applications, as well as
generation cytotoxic species for therapy. In the former case light
activation is achieved with a low fluence rate to generate fluorescence
emission with little or no cytotoxic effect, while in the latter case a high
fluence rate is used to generate a sufficient concentration of cytotoxic
species to achieve biological effects.

A timeline of selected milestones in the historical development of PDT.
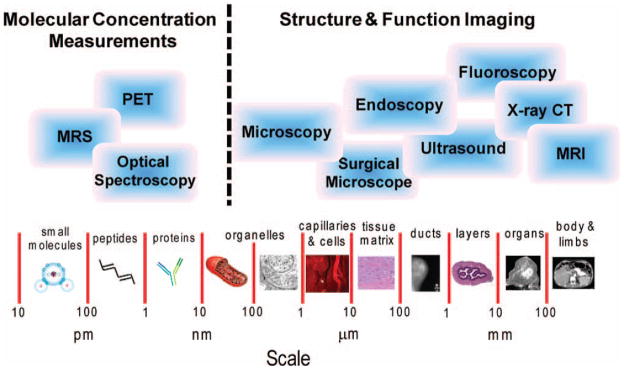
Imaging platforms for molecular structural and functional imaging across a
broad range of size scales. For molecular concentration imaging, (the left
side of the figure), optical spectroscopy and magnetic resonance
spectroscopy (MRS) are primarily employed, but positron emission tomography
(PET) can be used for imaging at these length scales. For structural and
molecular imaging at length scales greater than 10’s of nanonmeters
(the right side of the figure) a variety of imaging techniques can be
employed including various types of microscopy, endoscopy, x-ray computed
tomography (CT) and magnetic resonance imaging (MRI) depending on the size
and composition of the structure being imaged.
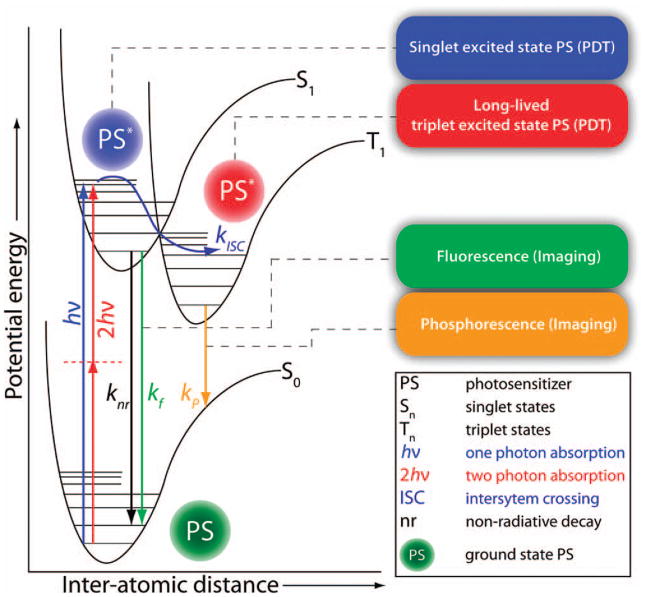
Perrin-Jablonski energy diagram for a photosensitizer (PS) molecule. Various
processes during the excited state lifetime of the PS and resulting from its
relaxation back to its ground state are highlighted. While in its long lived
triplet excited state the PS may undergo excited state reactions to generate
cytotoxic species such as singlet molecular oxygen (via energy transfer from
the PS to ground state, triplet oxygen). While both the excited singlet
state and triplet state are involved in photosensitized cell killing,
photodynamic killing comes primarily from the triplet manifold. PS
fluorescence and phosphorescence may be used to image PS localization in
tissue and time-resolved imaging techniques may be applied to monitor PS
interactions with its microenvironment.
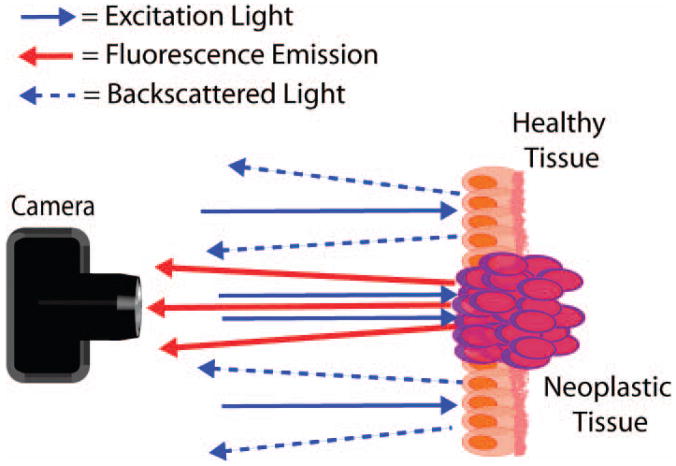
A schematic representation of the basic principles of photosensitizer
fluorescence detection. The photosensitizer accumulates preferentially in
neoplastic tissue (depicted as purple cells), which, upon excitation with
light of the appropriate wavelength (blue arrows) emits red fluorescence
emission (red arrows). The contrast generated by this fluorescence emission
against backscattered illumination (blue arrows with dashed lines) can be
used to demarcate the boundaries of neoplastic tissues for sensitive
detection of a variety of human cancers and optimization of surgical
resection. The backscattered illumination can be useful to observe
surrounding non-fluorescent tissue, though in many applications an emission
filter is placed before the observer or detector to exclude the
backscattered light.
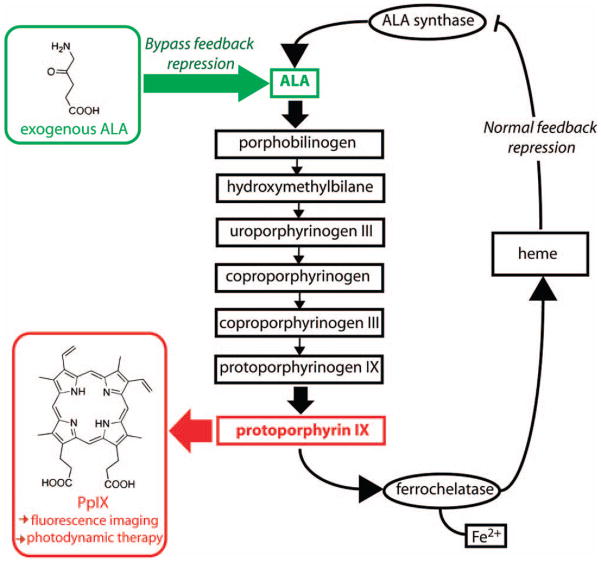
A schematic representation of the heme synthesis pathway which lead to
synthesis and accumulation of protoporphyrin IX in vivo. Under normal
physiological conditions, synthesis of PpIX is regulated by negative
feedback control of free heme on ALA synthase. This feedback is bypassed by
addition of exogenous ALA which, due to the relatively low rate of iron
insertion by the enzyme ferrochelatase, leads to accumulation of excess PpIX
that can be used either therapeutically, for PDT, or to generate
fluorescence contrast, for PFD.
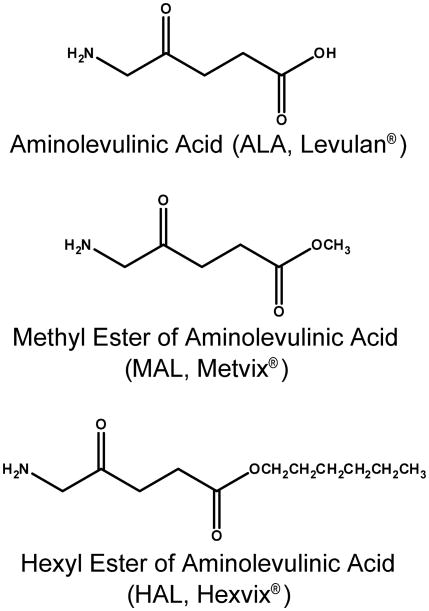
Structures of Aminolevulinic acid (ALA, Levulan) and its Methyl and Hexyl
Esters (MAL or Metvix® and HAL or
Hexvix® respectively).
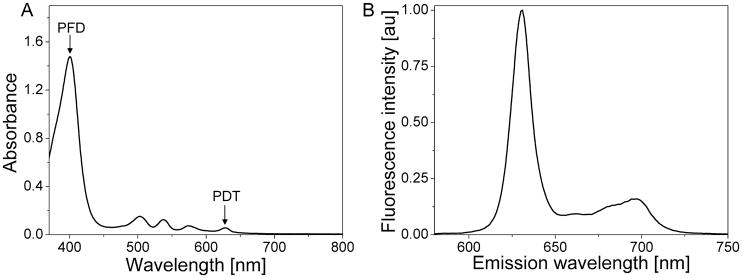
Absorption (A) and fluorescence emission (B) spectrum obtained from PpIX in
methanol. Positions of absorption maxima typically (although not
exclusively) used for PFD and therapeutic PDT applications are marked with
arrows.
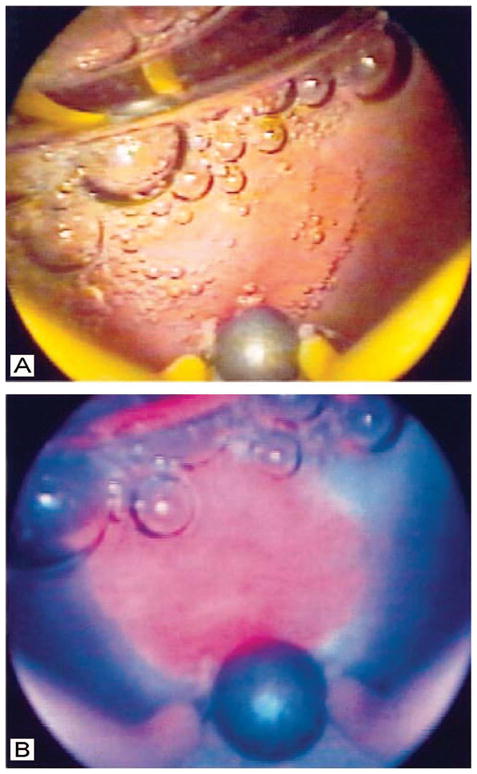
Comparison of white light and PpIX fluorescence images of an intermediate
grade malignant lesion in the bladder of a human patient, obtained via
cystoscopy. In the white light image (A), the lesion is not evident, while
in the PpIX fluorescence image obtained under blue illumination (B), the
lesion is readily visible as a pink region just above the large air bubble
in the lower middle part of the field. (Figure reproduced with permission
from ref . Copyright 1999 BJU
International.)
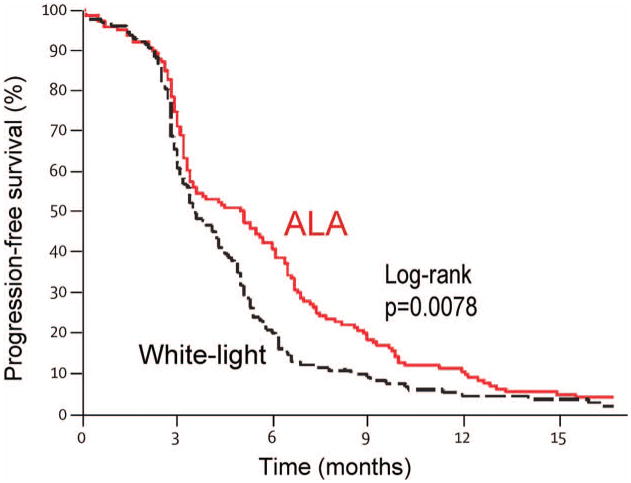
Progression free survival data by treatment group for the large multicenter
trial reported by Stummer et al in 2006, which compared white light and
fluorescence guided resection for treatment of malignant glioma. After 6
months there is a significant enhancement in progression free survival in
the 5-ALA group as compared to white light, while the two curves collapse
after 15 months. (Figure reproduced with permission from ref . Copyright 2006 Elsevier Ltd.)
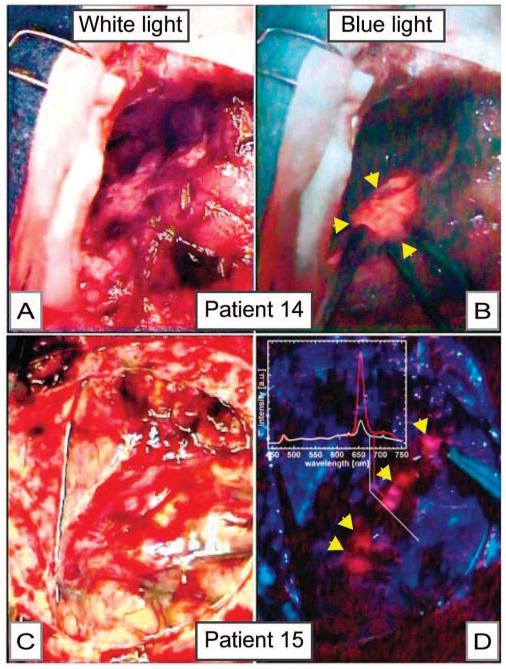
Intraoperative images of a partially resected brain tumor (A and B) and the
surface of the brain (C and D), comparing images obtained by white light (A
and C) and mTHPC fluorescence imaging under blue light (B and D). In A, a
partially resected tumor is difficult to discern while it is readily
apparent in the blue-light mTHPC fluorescence image of the same tissue.
Similarly, in C (a white light image of the surface of the brain), there is
no apparent tumor, while the mTHPC fluorescence image, which is complemented
by spectroscopy (inset) of the same field reveals the presence of
malignancy. (Figure reproduced with permission from ref . Copyright 2001 American Society for
Photobiology.)
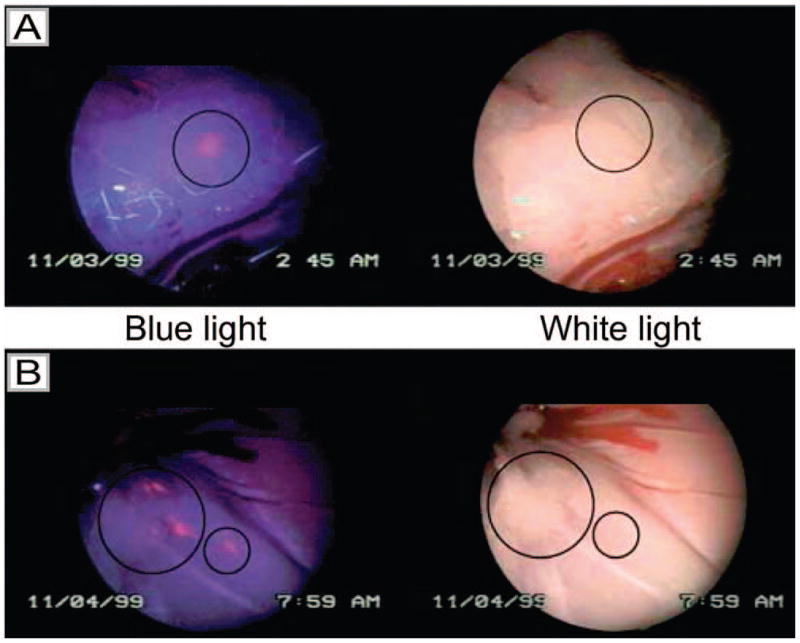
Laparoscopic images of peritoneal metastases in a rat model of ovarian cancer
obtained by white light imaging (right) and HAL-induced PpIX fluorescence
imaging under blue light illumination (left). Image (A) shows a lesion that
is only visible in the blue light mode, but not by white light (position
marked by a circle) (8mM HAL after 2 h). Image (B) shows three lesions
visible by both blue and white light (big circle) and one only detectable by
fluorescence (small circle) (8mM HAL after 2 h). (Figure reproduced with
permission from ref . Copyright
2003 Cancer Research UK.)
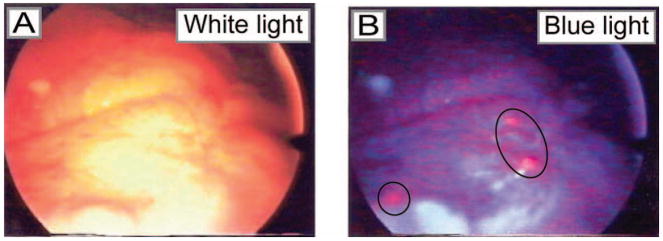
Laparoscopic images comparing metastatic ovarian carcinoma lesions in human
patients under white and blue light illumination following intraperitoneal
instillation of ALA in human patients. As observed in preclinical studies
for detection of micrometastatic ovarian cancer using PFD, lesions are
visible Tumor was detected on tissue specimens by strong red fluorescence,
in lesions measuring <0.5 mm. (Figure reproduced with permission from ref
. Copyright 2004 American
Cancer Society.)
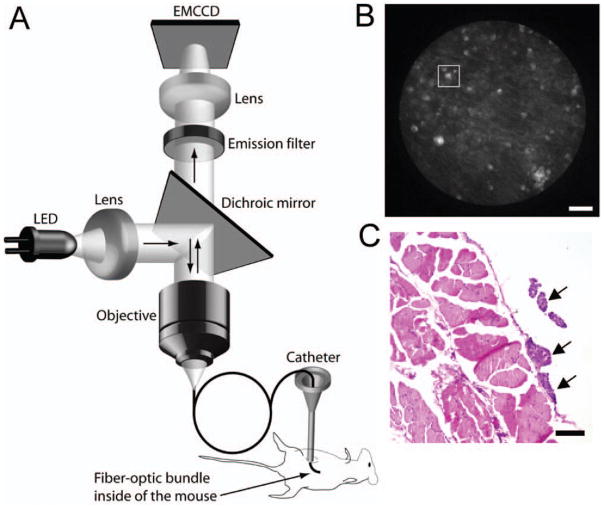
(A) Schematic of the prototype fiber-optic fluorescence microendoscope
imaging system. Fluorescence excitation is provided by a light emitting
diode (LED) which is directed through the objective via a dicrhoic mirror.
Excitation light is directed into the mouse through a flexible
sub-millimeter imaging fiber which also collects fluorescence emission. The
longer wavelength emission passes the dichroic mirror and is registered on a
CCD camera with on chip multiplication gain. (B) Fluorescence image of
microscopic tumor nodules (tens of microns in size) detected on the
peritoneal wall of an ovarian cancer mouse by the fluorescence
microendoscope using BPD as the contrast agent. Scale bar is 100 μm.
(C) H & E stain of a 5 μm section from the same region. Arrows
indicate tumor nodules. (Reproduced with permission from ref . Copyright 2009 Nature Publishing Group.)
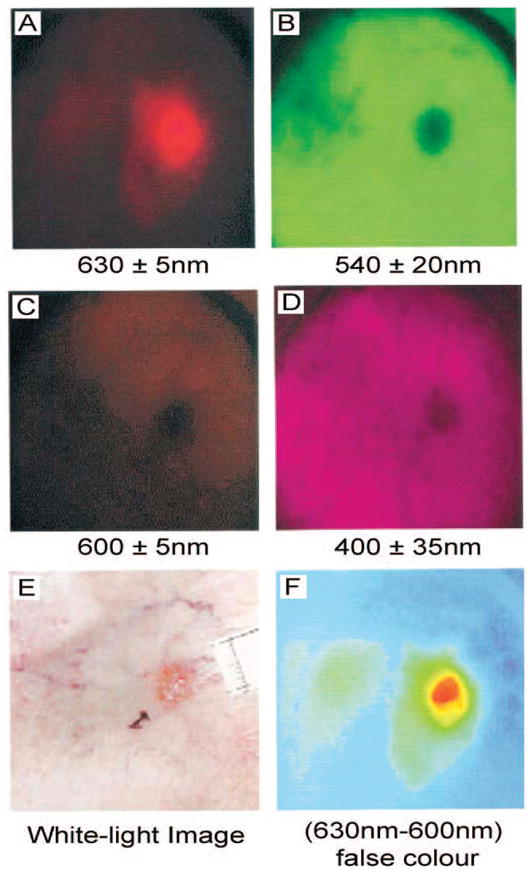
Multispectral images (A-D) taken pre-PDT of a superficial BCC on the ankle
and the corresponding white-light image (E) taken before ALA application.
Real-time image processing displays the difference between the 630 and 600
nm images displayed with a false color scale (F) showing clearly the extent
of the lesion and the differential accumulation of PpIX in the SBCC compared
with the application site and surrounding healthy tissue. Scale bars for
these images were not available. (Figure reproduced with permission from ref
. Copyright 2001 Wiley.)
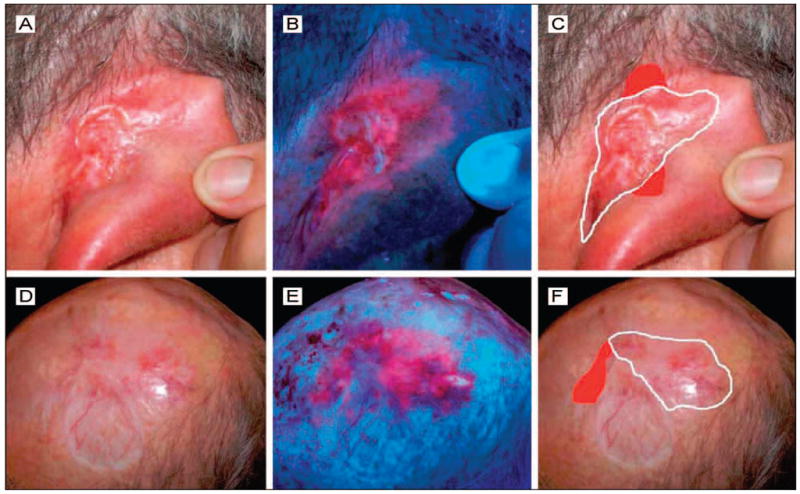
MAL induced PpIX fluorescence images of two patients (A-C, and D-F) who
received Mohs micrographic surgery (MMS). Images were obtained 3 hours
following administration of MAL. Clinical pictures showing the outlines of
the first MMS excision (white lines) were conducted without respect to the
fluorescence images. The “real margins” of the tumors
confirmed by histopathologic analysis are also included (red areas) and were
already delineated by the fluorescence seen in panels B and E. The agreement
between the fluorescence and histopathology margins suggests that the use of
PFD may speed up Mohs surgery by reducing the number of step-wise excisions
necessary. (Figure reproduced with permission from ref . Copyright 2008 American Medical
Association.)
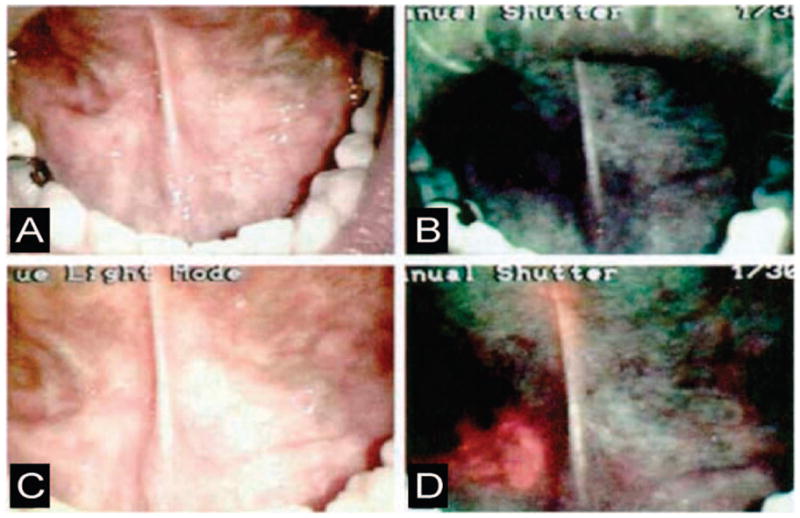
Comparison of white light and ALA induced PpIX fluorescence imaging
(excitation wavelengths = 375–440 nm) for identification of
oral cancer. (A) White light image of a tumor in the right floor of the
mouth. (B) Autofluorescence imaging under excitation with blue-violet light
of the same region. (C) The same region imaged again under ordinary white
light, 1.5 hours after application of ALA. D. PpIX fluorescence image of the
same region. (Figure reproduced with permission from ref . Copyright 2000 Wiley.)
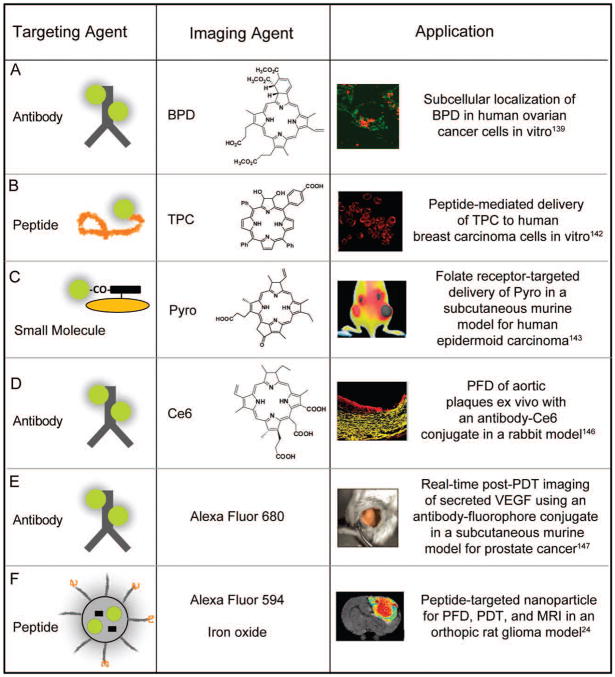
Disease-targeted constructs for PFD and PDT, showing the targeting moeity,
imaging agent, and biological application. (A) Ovarian cancer
cells incubated for 15h with 140nM equivalent BPD-C225 construct. A confocal
laser scanning fluorescence microscope is used to monitor the subcellular
localization of the PS with high spatial resolution, fluorescence from the
mitochondrial markers is shown in false color as green and BPD is shown in
false color as red;
(B) confocal microscopy shows that TPC conjugated to a
membrane-penetrating arginine oligopeptide (R7) enters MDA-MB-468 (human
breast carcinoma) cells efficiently where red represents fluorescence signal
from TPC; (C)
monitoring fluorescence signal distribution after intravenous injection of
100 nmol of Pyro-GDEVDGSGK-Folate conjugate to double tumor-bearing mice
(with a FR positive tumor on the right side and negative one on the left
side), indicates preferential accumulation of construct in the receptor
positive tumor, establishing NIR imaging ability of the targeted PS
construct; (D)
fluorescence from aortic segments 24 hr post injection of Ce6-maleylated
albumin conjugate indicates the constructs ability to detect and/or
photodynamically treat inflamed plaques. Red represents Ce6 and yellow is
tissue autofluorescence from the elastic fibers; (E) post-PDT changes in VEGF
expression are monitored with the molecular imaging strategy, where an
Avastin-Alexa Fluor construct was imaged in PDT-treated subcutaneous PC-3
(prostate cancer) tumors, 6 h following laser irradiation and fluorescence
image of tumor labeling is pseudocolored in gold; and (F) T2-weighted magnetic
resonance images at day 8 after PDT treatment from F3-targeted
Photofrin-containing nanoparticles in a 9L brain tumor showing imaging and
monitoring of therapeutic efficacy post treatment. (Figures reproduced with permission from: (A)
ref . Copyright 2006, The
International Society for Optical Engineering (SPIE); (B) ref . Copyright 2006, Wiley; (C) ref
. Copyright 2007, American
Chemical Society; (D) ref .
Copyright 2008, The Royal Society of Chemistry and Owner Societies; (E) ref
. Copyright 2008, American
Association for Cancer Research; and (F) ref . Copyright 2006, American Association for Cancer
Research.)

Concept design and application of PS fluorescence in site-activated
constructs. (A) Release of Ce6 for PFD and PDT following
cleavage of a cathepsin-B-specific construct in a subcutaneous murine model
for human fibrosarcoma. Three-dimensional fluorescence-mediated tomography
was used to image the HT1080 fibrosarcomas following 24 h incubation with a
poly-L-lysine-Ce6 construct (0.125 mg Ce6 eq./kg). (B) Proof-of-concept study
demonstrating the cleavage of a peptide linker by MMP-7 for PFD and PDT in a
subcutaneous murine model for human epidermoid cancer. The
PPMMP7B construct (drug) was injected intravenously (80nmol) in a
single mouse bearing two KB tumors on each hind leg. Only one tumor, left
leg, was treated and this mouse was monitored by white light and
fluorescence imaging before treatment (left image, 3 h after drug injection)
and 1 h after PDT (right image, 5 h after drug injection) on one hind flank.
Right Image: Treated tumor on the left leg became edematous one hour post
PDT while no fluorescence change is observed in untreated right tumor. (C) Mechanism for the
cleavage of an enzyme activated prodrug where the blue balls represent the
inactive PSs in the uncleaved construct, and the red balls represent the
photoactive PSs. The image shows PS fluorescence in cellular co-cultures of
S. aureus with human foreskin fibroblasts (HFF) where
significantly greater fluorescence intensity is observed in bacterial cells,
than in the neighboring fibroblasts indicating cleavage of construct only at
the site of infection. (Figures
reproduced with permission from: (A) ref ; Copyright 2006, American Association for Cancer Research.
(B) ref ; Copyright 2007, The
National Academy of Sciences of the USA. (C) ref ; Copyright 2009, Wiley.)
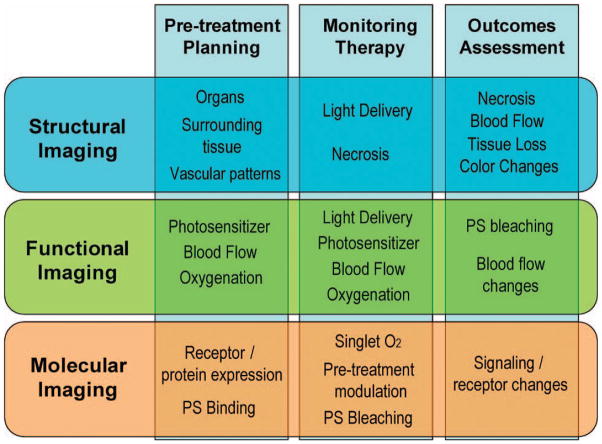
A schematic diagram depicting the intersecting roles of imaging in key steps
of pre-treatment planning, therapy monitoring, and outcome assessment.
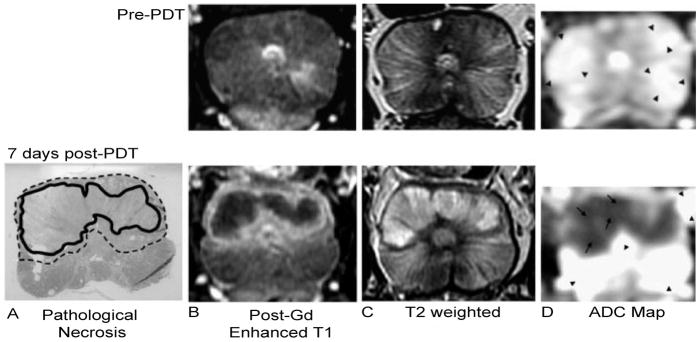
An example of structural imaging for PDT outcome assessment. PDT of the
prostate was monitored with MRI before (top panel) and 7 days after PDT
(bottom panel). The results of Tookad-PDT in the prostate are evident. A)
The pathological necrosis is circled with the bold black line, while the
transition region showing signs of inflammation and edema is indicated with
the dotted line. Post-gadolinium contrast-enhanced T1-weighted MRI (B) shows
that the necrotic region does not enhance, while the transition region
strongly enhances. The opposite is seen in the T2-weighted image (C). D) The
apparent diffusion coefficient map indicates that the necrotic region
(arrows) has a different diffusion rate (1000 ×
10−6 mm2/s) than the remaining prostate
(arrow heads, 2500 × 10−6 mm2/s).
(Reproduced with permission from ref . Copyright 2006, Wiley.)
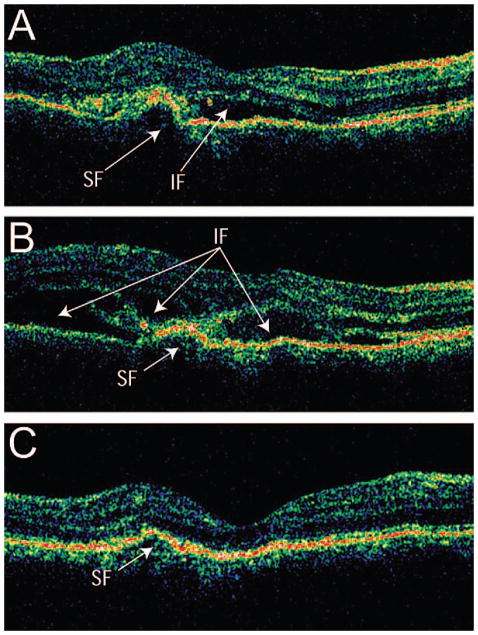
Cross-section OCT B-scans of a patient with subfoveal choroidal
neovascularization (CNV) treated with PDT, pseudocolored for reflectance
intensity. (A) One day before PDT, the presence of intraretinal and
subretinal fluid AMD can clearly be seen with OCT. (B) One day after PDT,
increased intraretinal and subretinal fluid can be seen. (C) After one week
following treatment, the OCT reveals substantial decrease in both
intraretinal and subretinal fluid. (Reproduced with permission from ref
. Copyright 2006,
Elsevier.)
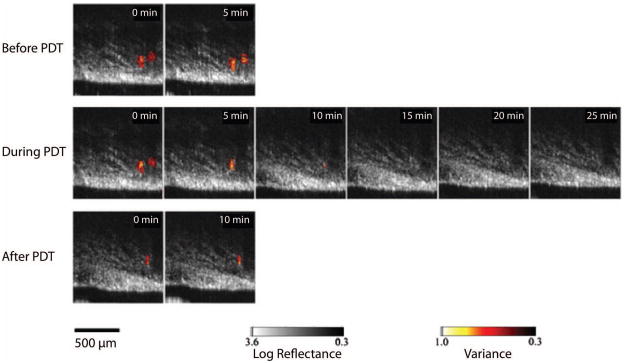
Comparison of Doppler OCT images of a Dunning prostate tumor before (top
panels), during (middle panels), and after (bottom panels) exposure to
light. The cross-sectional area of the blood vessels was reduced during the
treatment, with some vasodilation observed after treatment. The leftmost
blood vessel was seen to constrict first, and did not recover after the
treatment was completed. (Reproduced with permission from ref . Copyright 2006, Wiley-Liss.)
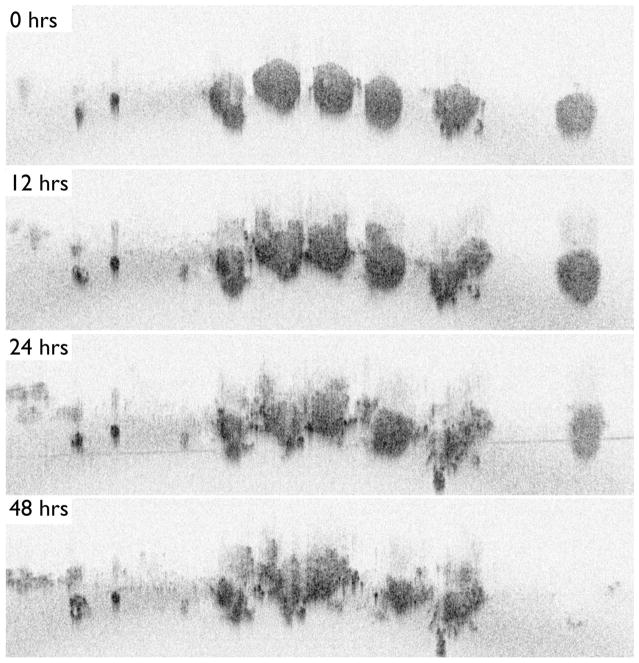
An application of TLOCT for studying the basic tumor biology of PDT response,
demonstrating a series of OCT cross-sectional images of ovarian cancer acini
taken from a full 3D data set at time points following BPD-PDT. (A) Ovarian
cancer acini appeared as small, solid and spherical structures immediately
following treatment (B). Twelve hours post-PDT, signs of structural
breakdown were seen (C). One day after PDT, the acini showed large-scale
structural deformation with the appearance of apoptotic cell clusters at the
nodules’ periphery. Few structural differences can be seen between
24 and 48 hours (D) following treatment. Reproduced with permission from ref
. Copyright 2010, SPIE.
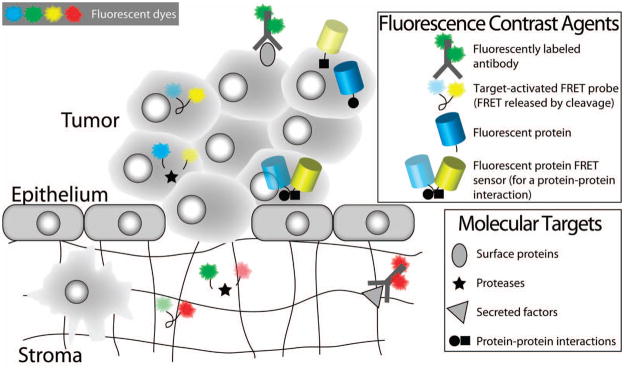
Fluorescence contrast agents relevant for molecular imaging of biological
responses to PDT. Fluorescently labeled antibodies, target-activated probes
and genetically encoded fluorescent proteins are examples of fluorescence
contrast agents that have been applied for molecular imaging of biological
responses to PDT. This figure highlights the use of these contrast agents
for detecting molecular factors in both the intracellular and extracellular
spaces. The natural clearance of unbound antibody-fluorophore conjugates
from the extracellular space enables their use for labeling cell surface
proteins and extracellular secreted factors. Target-activated probes based
on FRET (as shown here) or ground state quenching, are applicable for
imaging both intracellular and extracellular factors. Fluorescent proteins
(an endogenous labeling scheme) are useful for monitoring protein expression
levels and protein-protein interactions, and for visualizing protein
trafficking. Fluorescent protein FRET sensors also exist and can be used to
detect protein-protein interactions. Examples of the application of these
contrast agents for studying PDT-induced molecular mechanisms are shown in
Figure 28 and are discussed in the
text.
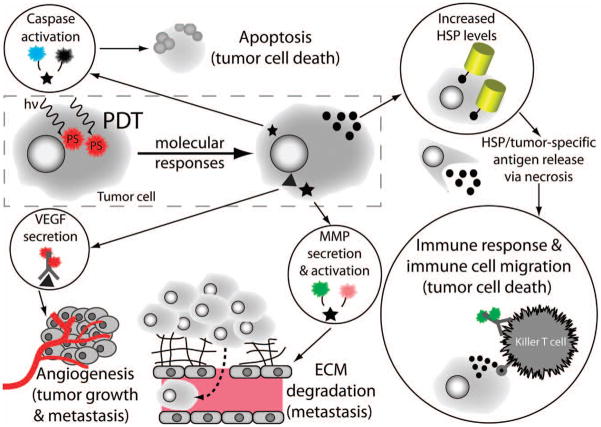
Imaging of molecular mechanisms induced by PDT using the fluorescence
contrast agents introduced in Figure
27. The ability to image critical molecular responses in tumors
and proximal tissue following PDT is crucial for the development of
effective therapeutic strategies designed to abrogate tumor survival and to
enhance proapoptotic and immune-based responses. Examples of specific
molecular targets and fluorescence contrast agents for imaging each of these
mechanisms are shown in circles. The specific mechanisms shown here are:
executioner caspase activation, increased expression of HSPs, immune cell
migration, and secretion of VEGF and MMPs. These biological responses
include both cellular death and pro-survival signaling pathways. Cellular
death signaling includes the induction of the apoptotic cascade (see Section
5.3), and, separately, the activation of an immune response to
tumor-specific antigens and inflammation. Pro-survival signaling includes
increased production of certain proteins as part of the cellular stress
response for repairing damage resulting from the generation of ROS during
PDT (see Section 5.4), and the secretion of cytokines and enzymes to
manipulate the tumor microenvironment. The secreted factors VEGF and MMP are
important for tumor growth and metastasis (and are discussed in Section
5.5).
Imaging the activation dynamics of a proapoptotic factor and its cellular
trafficking during PDT-induced apoptosis. A genetically encoded FRET sensor
reports the dynamics of Bid (a key proapoptotic protein) activation and
trafficking of its activated/truncated form (tBid) to the mitochondria
during NPe6-PDT-induced apoptosis. (A & B) The temporal
dynamics of Bid activation are visualized as a loss of FRET quenching of CFP
fluorescence emission (i.e., increased CFP fluorescence - labeled as the
“CFP” channel) and as a concomitant loss of YFP fluorescence
due to FRET (labeled as the “FRET” channel) using the
FRET-Bid fluorescent protein sensor described in the text. (C &
D) Time-lapse images and quantification of tBid-CFP (activated
Bid) trafficking from the cytosol into the mitochondria are shown, following
cleavage of the FRET-Bid sensor. The bars represent the percentage of cells
showing Bid translocation to mitochondria at the indicated time points.
Scale bar: 10 μm. (Adapted with permission from ref . Copyright 2008 Wiley).
In vivo molecular imaging of a cellular stress response to PDT. The figure
shows images of increased heat shock protein expression in an EMT6 (mouse
mammary carcinoma) tumor, a molecular response to acute cellular stress
during PDT. In this experiment, GFP-transfected EMT6 cells were implanted
into mice subcutaneously, where GFP expression is driven by the activation
of the heat shock protein 70 (HSP70) promoter and GFP fluorescence is used
to visualize the HSP70 expression level. (A) Before and
(B) 6 hours after PDT. The GFP fluorescence increases
substantially following PDT, indicating an up-regulation in HSP70
expression. (Reproduced with permission from ref . Copyright 2003 Wiley).
A preliminary demonstration of in vivo molecular imaging of a secreted,
proteolytic enzyme important for metastasis. The fluorescence images are of
an MMP7-activated dual probe and PS agent. (A) A brightfield
image of a mouse bearing two KB (human nasopharyngeal epidermoid carcinoma,
an MMP7+ cancer cell line) tumors, one in each flank as indicated by
the arrows. (B-E) Whole-body fluorescence images of the mouse
before and after administration of the MMP7-activated probe/PS.
(B, Prescan before i.v. injection of the target-activated
fluorescent probe; C, 10 minutes post-injection of the probe;
D, 3 hours post-injection; and E, 1 hour
following PDT). Note that the circle in (D) demarks the tumor
in the left flank, which received light irradiation while the right flank
served as a “No Light” control. (F) Photograph
of the same mouse 30 days following PDT. Note that the left flank tumor
exhibits reduced tumor burden in comparison to the right flank. This
represents a promising outcome; although, only a single mouse was tested.
(Adapted with permission from ref . Copyright 2007 National Academy of Sciences).
In vivo molecular imaging of cytokine secretion dynamics in response to PDT.
Here, fluorescence hyperspectral imaging has been applied to acquire a
secreted VEGF level time-course in subcutaneous prostate cancer tumors (PC-3
human prostate cancer cells) following PDT. (A) Overlay of
Avastin-AF488 conjugate (contrast agent for secreted VEGF,
CAVEGF) fluorescence images (after spectral unmixing and
calibration to a dye standard) and monochromatic reflectance images for a
PDT-treated and a nontreated tumor. The CAVEGF fluorescence
amplitude is false colored gold. (B) Average calibrated
fluorescence intensity of PDT-treated and nontreated tumors at 1, 3, 6, 9,
and 24 hrs following PDT. The CAVEGF fluorescence stabilizes
after 24 hrs. Full time courses reveal a peak in VEGF secretion 24 hrs
post-PDT, which returns to its pre-PDT baseline value after 3–7
days. The peak in secreted VEGF levels represents an opportune/critical time
period for inhibiting VEGF activity. (Reproduced with permission from ref
. Copyright 2008 American
Association for Cancer Research).
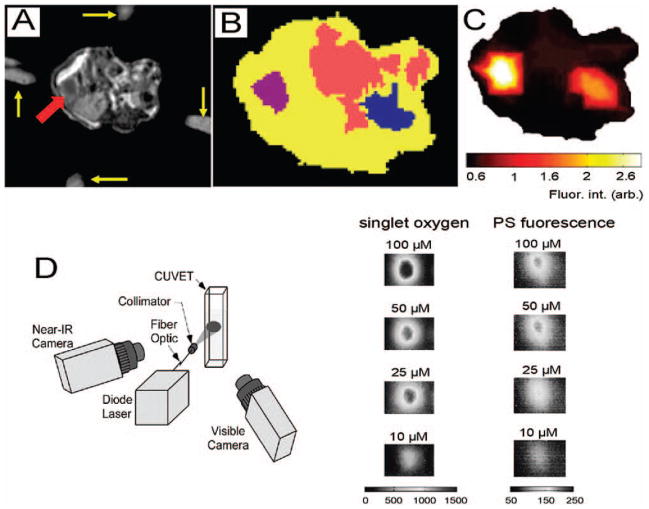
Examples of multimodal molecular imaging for PDT. MRI-guided fluorescence
molecular tomography with EGF labeled IRDye 800CW (LI-COR
Biosciences). (A-C) provides both structural and
functional information about the target tissue, in this case a pancreatic
tumor. Singlet oxygen phosphorescence and PS fluorescence monitoring
(D & E) can be used for dosimetry, treatment monitoring
and assessment. (A) An axial T1-weighted gadolinium contrast
enhanced MR image of a mouse. The yellow arrows indicate fiducials that mark
the placement of the optical fibers for fluorescence detection and the red
arrow indicates the tumor. (B) Segmentation of the abdomen in
relevant tissues based on significant fluorophore localization, absorption
and scattering properties; the tumor is in purple, the intestine in pink,
the right kidney in blue and the remaining abdomen is in yellow.
(C) The EGF-IRDye 800CW fluorescence reconstruction of the
mouse abdomen based on the segmentation in B and the assumption that there
are heterogeneous distributions of the optical properties within each of the
segements, i.e. soft priors. The EGF-IRDye 800CW was injected intravenously
48 hours prior to imaging. (D) The combined singlet oxygen
phosphorescence and photosensitizer fluorescence imager developed by PSI is
shown. (E) Simultaneous phosphorescence and fluorescence images
can be produced. In this case solutions of the PS Ce6 were used. (Reproduced
with permission from refs. ,. Copyright 2009 SPIE).
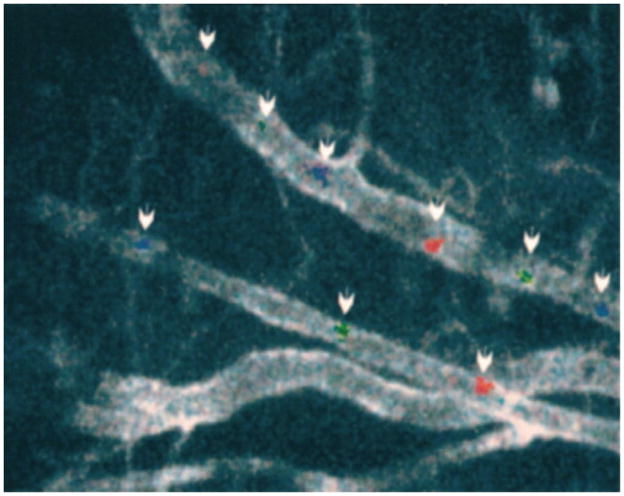
In vivo imaging of fluorescently labeled, circulating tumor cells for the
detection of metastatic disease. Combined image of three still frames,
spanning 200 ms, acquired at video rate showing fluorescently labeled rat
prostate cancer cells (MLL cells) traveling through an artery vein pair. Two
cells are highlighted along the vein (top vessel) and one cell along the
artery (bottom vessel) using blue, green, and red for the same cells as they
are imaged in the first, second, and third frames, respectively. The
vascular endothelium is labeled with anti-platelet/endothelial cell adhesion
molecule-1 (CD31) conjugated to Cy5. As discussed in the text, the in vivo
detection of circulating cancer cells is a powerful approach for the early
assessment of response to therapy (e.g., detection of metastasis and/or its
mitigation using combination therapies). (Reproduced with permission from
ref . Copyright 2004 American
Association for Cancer Research).
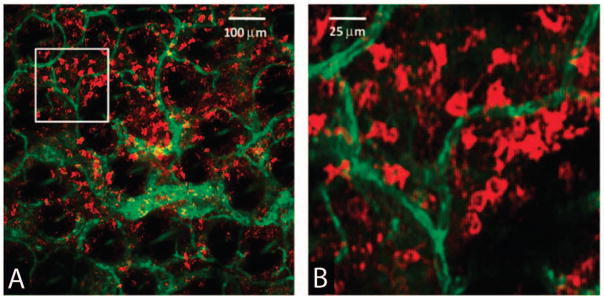
Imaging of immune cell populations in living specimens, which may potentially
be applied for online monitoring of immune responses to PDT. In vivo
confocal fluorescence images of immune cells are shown using an
antibody-fluorescent dye conjugate injected into a tumor, after allowing 2
hours for unbound conjugate to clear. Here, an antibody-dye conjugate
targeted to MHC-II (major histocompatibility complex Class II) labels
dendritic MHC-II+ cells in an EMT6 (mouse mammary carcinoma) tumor
grown intradermally in a mouse ear. (A) Positively stained
dendritic MHC-II+ cells are labeled with a fluorescent antibody
conjugate (red) at a depth of 80 μm in the tumor in the presence of
a highly vascularized tumor microenvironment (green color indicates the
CD31-fluorophore conjugate, which labels the vasculature). (B)
Expanded views of the region of interest indicated by the white box
superimposed on (A). In vivo imaging of immune cell trafficking
is an exciting prospect for therapeutic monitoring (e.g., to optimize
protocols for PDT-induced anti-tumor immune response). (Reproduced with
permission from ref . Copyright
2008 SPIE).
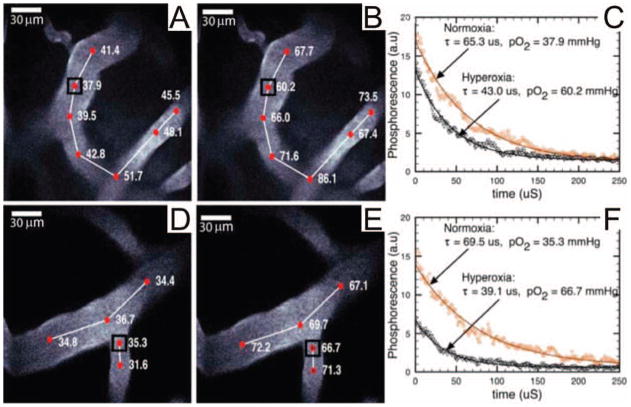
In vivo monitoring of oxygen tension by time-resolved PS phosphorescence
imaging, which has potential implications for PDT dosimetry. The images are
of arteries 120 and 100 μm below the surface experiencing both
normoxia (A,D) and hyperoxia (B,E), respectively.
The phosphorescence decay data and best fit curves (C,F) are
given for the points in A,B,D, and E. Regions under hypoxia have shorter
lifetimes due to increased oxygen concentration. The monitoring of oxygen
tension may be applied to record the consumption of molecular oxygen during
PDT, to help determine the deposited PDT dose, and to identify hypoxic
regions that may be resistant to PDT. pO2 values are given in
units of mmHg. (Reproduced with permission from . Copyright 2008, The Optical Society of
America.)
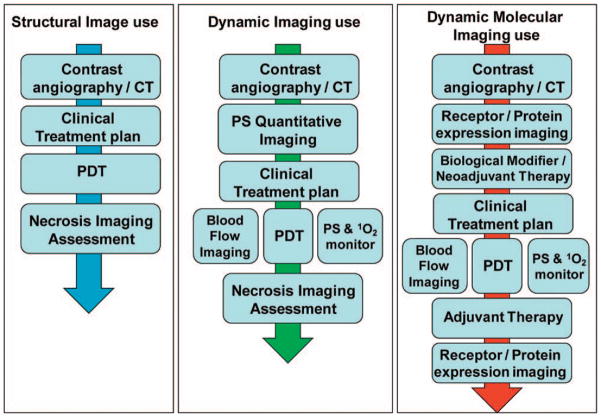
Examples of imaging workflow paradigms in PDT based on structural, dynamic
and molecular imaging. The left panel shows a simplified scenario in which
structural imaging is used to design the treatment plan, including the PDT
regimen, which is followed by post-procedural imaging to assess treatment
efficacy. The middle panel depicts implementations of dynamic imaging for
online monitoring of blood flow and generation of singlet oxygen during PDT
treatment. The right hand panel incorporates the additional level of
sophistication that can be achieved if the treatment planning, monitoring
and assessment workflow includes techniques for measurement of dynamic
biological responses, such as levels of activation of receptors and/or
secretion of key cytokines before and after treatment.
References
-
- Fitzpatrick TB, Pathak MA. J Invest Dermatol. 1959;32:229. - PubMed
-
- Epstein JH. N Engl J Med. 1990;322:1149. - PubMed
-
- Lipson RL, Baldes EJ, Olsen AM. J Natl Cancer Inst. 1961;26:1. - PubMed
-
- Kessel D. Photochem Photobiol. 1986;44:193. - PubMed
-
- Dougherty TJ. J Clin Laser Med Surg. 1996;14:219. - PubMed
Publication types
MeSH terms
Substances
Grants and funding
LinkOut - more resources
Full Text Sources
Other Literature Sources
