

The prevalence of Barrett's esophagus in the US: estimates from a simulation model confirmed by SEER data
- PMID: 20353441
- PMCID: PMC2896446
- DOI: 10.1111/j.1442-2050.2010.01054.x
The prevalence of Barrett's esophagus in the US: estimates from a simulation model confirmed by SEER data
Abstract
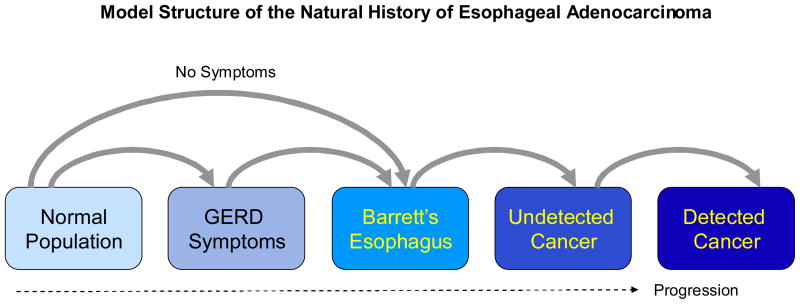
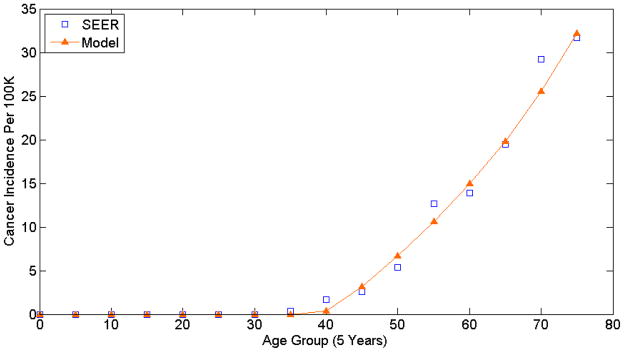
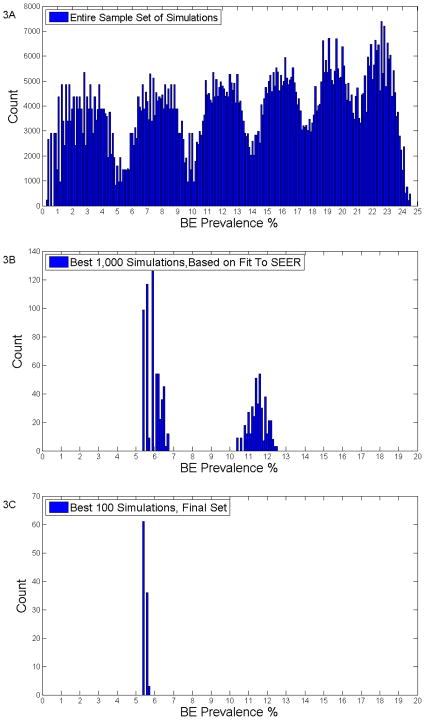
Barrett's esophagus (BE) is the precursor and the biggest risk factor for esophageal adenocarcinoma (EAC), the solid cancer with the fastest rising incidence in the US and western world. Current strategies to decrease morbidity and mortality from EAC have focused on identifying and surveying patients with BE using upper endoscopy. An accurate estimate of the number of patients with BE in the population is important to inform public health policy and to prioritize resources for potential screening and management programs. However, the true prevalence of BE is difficult to ascertain because the condition frequently is symptomatically silent, and the numerous clinical studies that have analyzed BE prevalence have produced a wide range of estimates. The aim of this study was to use a computer simulation disease model of EAC to determine the estimates for BE prevalence that best align with US Surveillance Epidemiology and End Results (SEER) cancer registry data. A previously developed mathematical model of EAC was modified to perform this analysis. The model consists of six health states: normal, gastroesophageal reflux disease (GERD), BE, undetected cancer, detected cancer, and death. Published literature regarding the transition rates between these states were used to provide boundaries. During the one million computer simulations that were performed, these transition rates were systematically varied, producing differing prevalences for the numerous health states. Two filters were sequentially applied to select out superior simulations that were most consistent with clinical data. First, among these million simulations, the 1000 that best reproduced SEER cancer incidence data were selected. Next, of those 1000 best simulations, the 100 with an overall calculated BE to Detected Cancer rates closest to published estimates were selected. Finally, the prevalence of BE in the final set of best 100 simulations was analyzed. We present histogram data depicting BE prevalences for all one million simulations, the 1000 simulations that best approximate SEER data, and the final set of 100 simulations. Using the best 100 simulations, we estimate the prevalence of BE to be 5.6% (5.49-5.70%). Using our model, an estimated prevalence for BE in the general population of 5.6% (5.49-5.70%) accurately predicts incidence rates for EAC reported to the US SEER cancer registry. Future clinical studies are needed to confirm our estimate.
Conflict of interest statement
No potential financial conflicts to report.
Figures
References
-
- Ries LAG, Melbert D, Krapcho M, Stinchcomb DG, Howlader N, Horner MJ, Mariotto A, Miller BA, Feuer EJ, Altekruse SF, Lewis DR, Clegg L, Eisner MP, Reichman M, Edwards BKe. Seer cancer statistics review, 1975–2005. National Cancer Institute; Bethesda, MD: 2008. http://seer.cancer.gov/csr/1975-2005/ based on November 2007 SEER data submission, posted to the SEER web site.
-
- Locke GR, 3rd, Talley NJ, Fett SL, Zinsmeister AR, Melton LJ., 3rd Prevalence and clinical spectrum of gastroesophageal reflux: A population-based study in olmsted county, minnesota. Gastroenterology. 1997;112:1448–1456. - PubMed
-
- Williamson WA, Ellis FH, Jr, Gibb SP, Shahian DM, Aretz HT, Heatley GJ, Watkins E., Jr Barrett’s esophagus. Prevalence and incidence of adenocarcinoma. Arch Intern Med. 1991;151:2212–2216. - PubMed
-
- Shaheen NJ, Crosby MA, Bozymski EM, Sandler RS. Is there publication bias in the reporting of cancer risk in barrett’s esophagus? Gastroenterology. 2000;119:333–338. - PubMed
Publication types
MeSH terms
Grants and funding
LinkOut - more resources
Full Text Sources
Medical
