. 2010 Mar;101(3):800-5.
doi: 10.1111/j.1349-7006.2009.01437.x.

A quantitative trait locus responsible for inducing B-cell lymphoblastic lymphoma is a hotspot for microsatellite instability

Affiliations

A quantitative trait locus responsible for inducing B-cell lymphoblastic lymphoma is a hotspot for microsatellite instability

Richard H Kaszynski et al. Cancer Sci. 2010 Mar.

Abstract

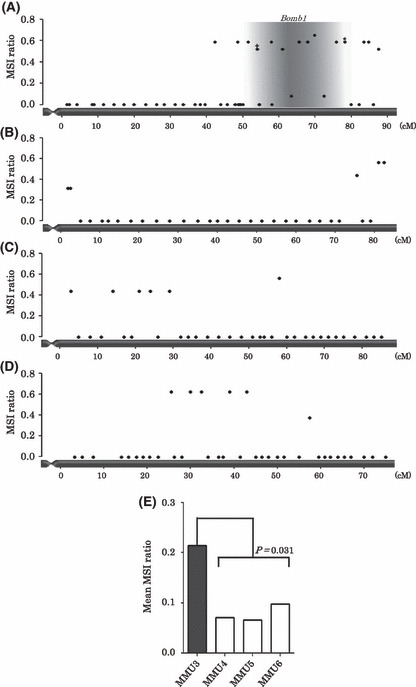
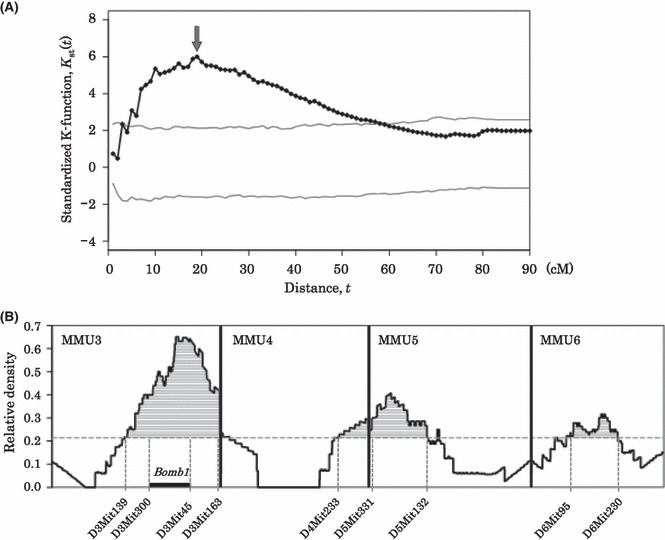
While the molecular mechanisms underlying microsatellite instability (MSI) have been exhaustively investigated, identifying the patterns of MSI distribution within diverse cancer genomes has remained an elusive issue. In the present study, we conducted genome-wide MSI screening in B-cell lymphoblastic lymphomas (B-LBL) which spontaneously develop in the SL/Kh strain of mice. Tumor samples harvested from 16 mice were investigated using a framework map consisting of 150 microsatellite markers spaced at increments of roughly 0.5-3.0 centimorgans, spanning the entirety of mouse chromosomes (mus musculus chromosomes [MMU]) 3-6. MMU3 contains a quantitative trait locus (QTL), Bomb1 (bone marrow pre-B1), known to induce an aberrant expansion of pre-B cells in bone marrow prior to the onset of B-LBL in SL/Kh mice. The remaining chromosomes were selected on the basis of those most closely resembling MMU3 in terms of total estimated length (maximum variance 10 Mb). MSI was confirmed at 2<or= markers in DNA derived from tumor tissues in 15 SL/Kh mice (93.7%), while healthy splenic DNA samples screened in parallel were consistently negative for MSI. The overall MSI incidence was significantly higher on MMU3 compared with MMU4-6 (P = 0.031). Additionally, by applying spatial point pattern analysis combined with a 1-D version of Ripley's K-function, we successfully demonstrated the predilection of MSI-susceptible loci to structure a massive cluster within the Bomb1 locus. Our study is the first to suggest that a QTL concomitantly serves as a hotspot for MSI-susceptible loci and sheds new light on somatic cancer genetics.


Figures

Figure 1
Figure 1
Microsatellite instability (MSI) screening in SL/Kh B‐cell lymphoblastic lymphomas. (A) MSI screening via 3% agarose gel electrophoresis. Agarose gel results obtained at three microsatellite markers showing three variant representations of MSI: insertion mutations resulting from the gain of simple repetitive sequences obtained at marker D3Mit139 (top), deletion mutations (the loss of simple repetitive sequences) observed at marker D3Mit77 (middle), and insertion/deletion mutations (the simultaneous presentation of both insertion and deletion mutations) observed at marker D3Mit319 (bottom). Lanes 1 and 2, SL/Kh spleen‐derived polymerase chain reaction (PCR) amplicons from two separate mice (mouse no. 202 and 211).Approximate band sizes are given for healthy control amplicons. Lanes 3 and 4, SL/Kh tumor‐derived PCR amplicons demonstrating partial band shifting (mouse no. 202 and 211). (B) Examples of microsatellite stability represented by the external control strains: NFS/N (top) and NFS.SL/Kh‐Bomb1 (bottom). Both strains failed to exhibit MSI at any of the examined loci, despite the fact that the introgressed SL/Kh Bomb1 segment in the NFS.SL/Kh–Bomb1 strain results in an aberrant polyclonal pro‐B cell expansion in bone marrow, mirroring the precursor lesion to lymphomagenesis in SL/Kh mice. Results are shown for markers D3Mit139, D3Mit77, and D3Mit319. (C) Representative allelic profile of SL/Kh spleen and tumor specimens at marker D3Mit139, as analyzed via capillary electrophoresis. Vertical and horizontal scales represent peak fluorescence intensity in relative fluorescence units (FU) and an estimate of PCR product size in base pairs (bp), respectively. The two flanking peaks in each electropherogram are size markers placed at 15 and 1500 bp. Amplicons obtained using normal (splenic) SL/Kh DNA as the template (left). PCR product obtained from tumor DNA showing mutant peak (right; arrow). In normal DNA, a single, dual‐intensity homozygous peak is observed, while in tumor amplicons, partial peak shifting is observed and FU is reduced to approximately half the intensity seen in normal tissue.
Figure 2
Figure 2
Transchromosomal comparison of microsatellite instability (MSI) incidence. MSI incidence for each microsatellite marker examined is obtained by dividing the number of MSI‐positive samples by the total number of typed lymphoma samples (n = 16). Plots are designed to reflect approximate chromosomal position of each individual microsatellite marker investigated in this study. MSI distribution is shown for the four mouse chromosomes investigated: (A) mus musculus chromosome (MMU)3, (B) MMU4, (C) MMU5, (D) MMU6. Bomb1 is shaded in gray. Data plots for markers D3Mit300 (55 cM) and D3Mit45 (78.5 cM) representing the boundaries for the Bomb1 locus are identified on MMU3 with symbols + and *, respectively. Overall MSI incidence was determined for each chromosome by calculating the combined average incidence of MSI per marker on each chromosome (E). cM, centimorgans.
Figure 3
Figure 3
Spatial point pattern analysis. Point pattern analysis for the distribution of microsatellite instability (MSI)‐susceptible loci along the chromosomes. (A) Plot of standardized K‐function for observed data (dark line) and 95% simulation envelope (gray lines). Statistical significance of the clustering of MSI‐susceptible loci is shown at the 0.05 level for distance, t (cM), where portions of the dark line stray above the upper gray line. Arrow indicates the point at which the observed K‐function deviates maximally from the null distribution for equal probabilities. (B) Chromosomal map of local density of MSI‐susceptible loci in the scale showing most significant clustering (=19 cM). Y‐axis indicates the observed count of MSI‐susceptible loci within 19 cM of each chromosomal position divided by the count of the actually examined microsatellite markers within the same segment. Dashed line denotes overall density (=32/150). Shaded areas represent genomic positions displaying a ratio of frequencies above the expected ratio (clustering). A region demonstrating the most extensive clustering is clearly recognized in the vicinity of the Bomb1 locus on mus musculus chromosome (MMU)3. cM, centimorgans.

Similar articles

Cited by

References

    1. Soslow RA, Baergen RN, Warnke RA. B‐Lineage lymphoblastic lymphoma is a clinicopathologic entity distinct from other histologically similar aggressive lymphomas with blastic morphology. Cancer 1999; 85: 2648–54. - PubMed
    1. Cheng A‐L, Su I‐J, Tien H‐F, Wang C‐C, Chen Y‐C, Wang C‐H. Characteristic clinicopathologic features of adult B‐cell lymphoblastic lymphoma with special emphasis on differential diagnosis with an atypical form probably of blastic lymphocytic lymphoma of intermediate differentiation origin. Cancer 1994; 73: 706–10. - PubMed
    1. Sander CA, Jaffe ES, Gebhardt FC, Yano T, Medeiros LJ. Mediastinal lymphoblastic lymphoma with an immature B‐cell immunophenotype. Am J Surg Pathol 1992; 16: 300–5. - PubMed
    1. Link MP, Roper M, Dorfman RF, Crist WM, Cooper MD, Levy R. Cutaneous lymphoblastic lymphoma with pre‐B markers. Blood 1983; 61: 838–41. - PubMed
    1. Pattengale PK, Frith CH. Immunomorphologic classification of spontaneous lymphoid cell neoplasms occurring in female BALB/c mice. J Natl Cancer Inst 1983; 70: 169–79. - PubMed

Publication types