. 2010 Mar 30:10:9.
doi: 10.1186/1472-6785-10-9.

What the hyena's laugh tells: sex, age, dominance and individual signature in the giggling call of Crocuta crocuta

Affiliations

What the hyena's laugh tells: sex, age, dominance and individual signature in the giggling call of Crocuta crocuta

Nicolas Mathevon et al. BMC Ecol. .

Abstract

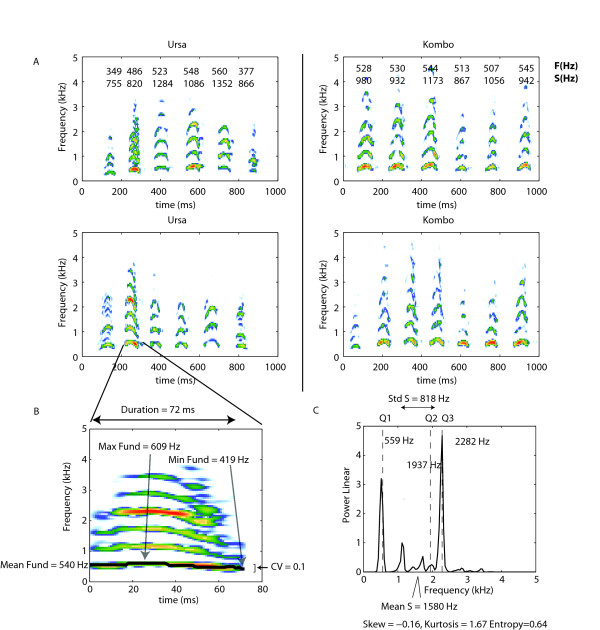
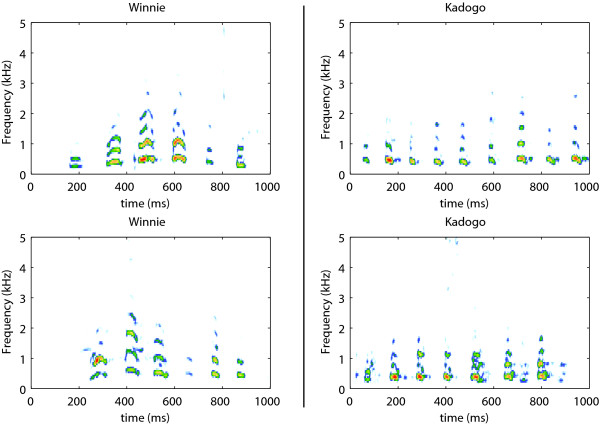
Background: Among mammals living in social groups, individuals form communication networks where they signal their identity and social status, facilitating social interaction. In spite of its importance for understanding of mammalian societies, the coding of individual-related information in the vocal signals of non-primate mammals has been relatively neglected. The present study focuses on the spotted hyena Crocuta crocuta, a social carnivore known for its complex female-dominated society. We investigate if and how the well-known hyena's laugh, also known as the giggle call, encodes information about the emitter.

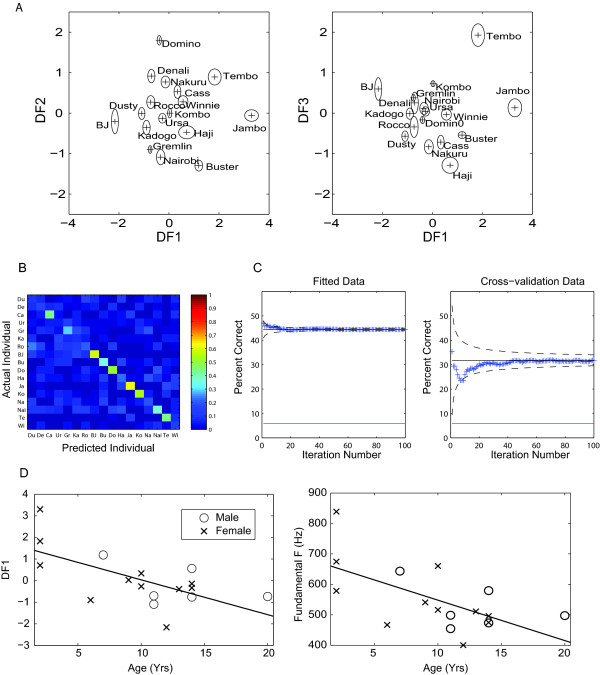
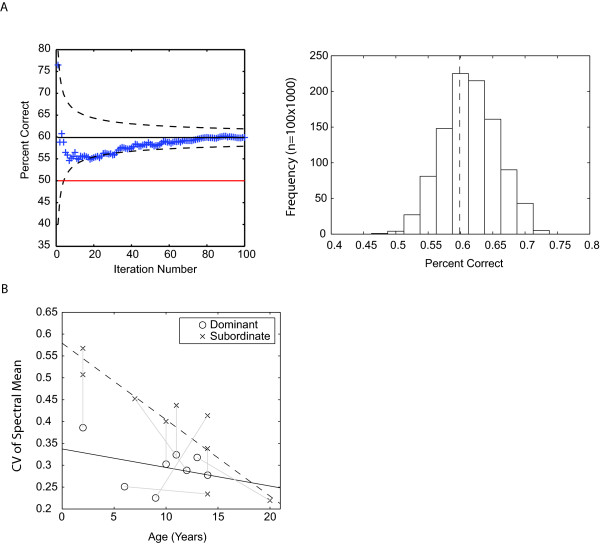
Results: By analyzing acoustic structure in both temporal and frequency domains, we show that the hyena's laugh can encode information about age, individual identity and dominant/subordinate status, providing cues to receivers that could enable assessment of the social position of an emitting individual.

Conclusions: The range of messages encoded in the hyena's laugh is likely to play a role during social interactions. This call, together with other vocalizations and other sensory channels, should ensure an array of communication signals that support the complex social system of the spotted hyena. Experimental studies are now needed to decipher precisely the communication network of this species.


Figures

Figure 1
Figure 1
Acoustic structure of the hyena's giggle (laughing) call. A. Two giggle bouts emitted by two different individuals (Ursa and Kombo). The mean fundamental F(Hz) and the spectrum mean S(HZ) for each giggle note is shown on top of its spectrographic representation for the giggle bouts in the first row. Ursa is a subordinate animal while Kombo is a dominant animal. Ursa is a 10 yr old female and Kombo is a 9 yr old female. They are both control animals (no hormonal treatment). The sounds of the giggle bouts for Ursa are available as Additional Files 1 and 2. The sounds of the giggle bouts for Kombo are available as Additional Files 3 and 4. B. Spectrogram of the second giggle note from the bout for Ursa shown in the lower panel. The fundamental frequency is underlined in black. From this time varying fundamental frequency, we extracted the mean, the minimum and maximum values as well as the coefficient of variation (CV). The values for this note are shown on the plot. C. Frequency spectrum of the giggle note shown in B. From the frequency spectrum, we obtained the mean frequency, standard deviation, skew, kurtosis, entropy and the three frequency values that delineate the quartiles in energy. The values for this note are shown on the plot (see main text for additional details about fundamental calculation and measurements of acoustic parameters)
Figure 2
Figure 2
A second example of the hyena's giggle call for two experimental animals. A majority of animals used in this study were treated with hormones or gonadectomized as participants in other research projects. In this figure, we show two giggle bouts emitted by two different individuals, Winnie and Kadogo. Winnie is a 14 yr old male treated with anti-androgens in utero. Kadogo is a 6 year old female treated with anti-oestrogens in utero. Hormonal treatment did not have an effect on the acoustical structure of the giggle notes or giggle bouts as assessed by our measures. Winnie is a subordinate animal while Kadogo is a dominant animal. The sounds of the giggle bouts for Winnie are available as Additional Files 5 and 6. The sounds of the giggle bouts for Kadogo are available as Additional Files 7 and 8.
Figure 3
Figure 3
Individual and age information in the gigglenote. A. Position of individuals' centroids in function of the first three discriminant variables that maximizes individual separation. The left panel shows the centroids on a 2D projection for discriminant variables 1 and 2 and the right panel shows the centroids on a 2D projection for discriminant variables 1 and 3. The discriminant functions have been scaled so that the within-variance is 1; in other words, assuming normality, for each animal, 67% of its notes would be found in a sphere of radius 1 centred on these centroids. The plotted ovals around the centroids show one standard error of the mean. B. The confusion matrix obtained from the DFA on the cross-validation data set. The confusion matrix shows by colouring cell (i, j) the conditional probability of guessing that the test giggle notes came from individual j when in fact it was emitted by i. C. Average (cumulative) percent correct of calls classification according to the emitter's identity as a function of the number of random iterations for the data used to fit the discriminant functions (left) and for the data used for cross-validation (right). The dotted lines show two standard errors deviations from the final mean. The red line shows chance. D. Correlation between age and giggles' acoustic structure as described by the first discriminant function (left panel) and as described by fundamental frequency (right panel).
Figure 4
Figure 4
Dominance information in the giggle note. A. Left panel. Percent correct of calls classification according to the emitter's dominant/subordinate status as a function of iteration for cross-validation data. The cumulative average percent correct is plotted as a function of the iteration number. The solid red line shows chance and the dotted black lines the standard error of the estimate. Right panel. Distribution in the percent correct that is found by randomly assigning individuals to different groups. Although the discriminant function is significant and yields classification rates above chance, the permutations show that this successful classification could be solely due to individual differences and not to dominant/subordinate status. B. Coefficient of variation (CV) of the spectrum mean frequency calculated from all giggle notes for each individual. The CV is higher in subordinate animals than in dominant animals and decreases with age. The grey lines link the animals that were housed together and form the dyadic dominant/subordinate pairs.

References

    1. Maynard Smith J, Szathmary E. The major transitions in Evolution. San Francisco, Freeman; 1995.
    1. Clutton-Brock T. Breeding together: kin selection and mutualism in cooperative vertebrates. Science. 2002;296:69–72. doi: 10.1126/science.296.5565.69. - DOI - PubMed
    1. Krause J, Ruxton GD. Living in groups. New York, Oxford University Press; 2002.
    1. Frank SA. All of life is social. Cur Biol. 2007;17:R648–R650. doi: 10.1016/j.cub.2007.06.005. - DOI - PubMed
    1. Hamilton WD. The genetical evolution of social behaviour. I J Theor Biol. 1964;7:1–16. doi: 10.1016/0022-5193(64)90038-4. - DOI - PubMed

Publication types