

Development of an invasively monitored porcine model of acetaminophen-induced acute liver failure
- PMID: 20353598
- PMCID: PMC2856523
- DOI: 10.1186/1471-230X-10-34
Development of an invasively monitored porcine model of acetaminophen-induced acute liver failure
Abstract
Background: The development of effective therapies for acute liver failure (ALF) is limited by our knowledge of the pathophysiology of this condition, and the lack of suitable large animal models of acetaminophen toxicity. Our aim was to develop a reproducible invasively-monitored porcine model of acetaminophen-induced ALF.
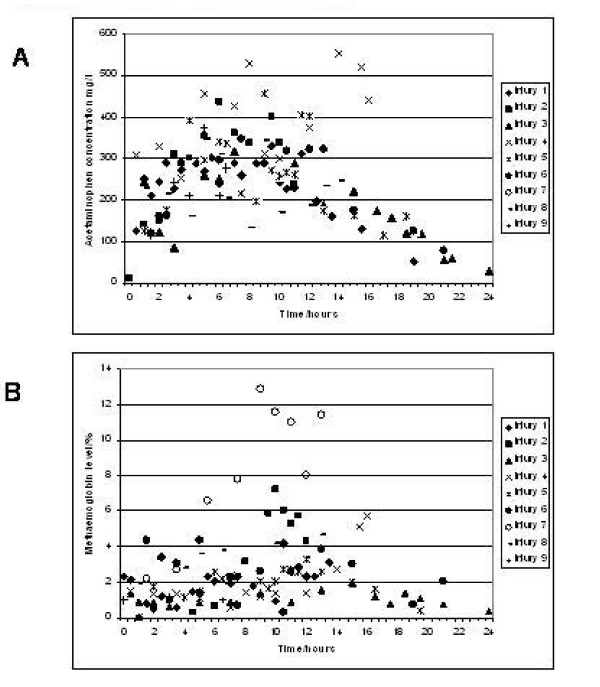
Method: 35kg pigs were maintained under general anaesthesia and invasively monitored. Control pigs received a saline infusion, whereas ALF pigs received acetaminophen intravenously for 12 hours to maintain blood concentrations between 200-300 mg/l. Animals surviving 28 hours were euthanased.
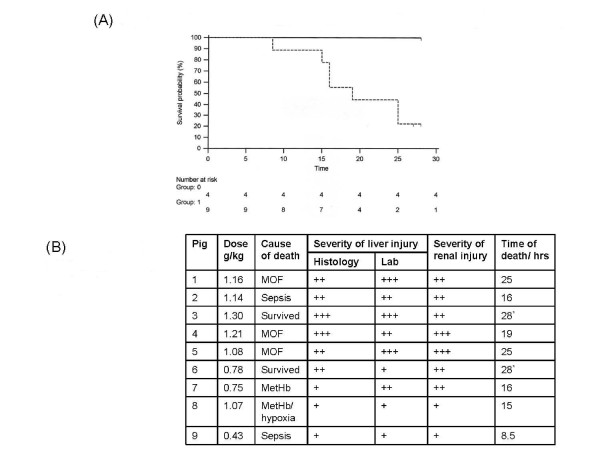
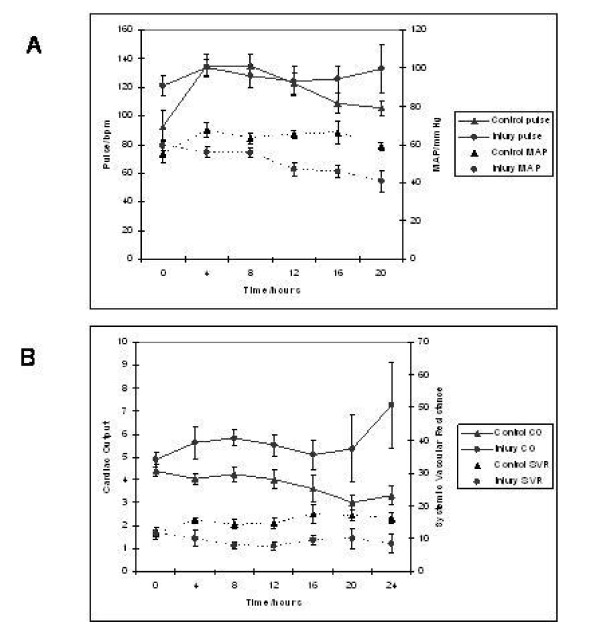
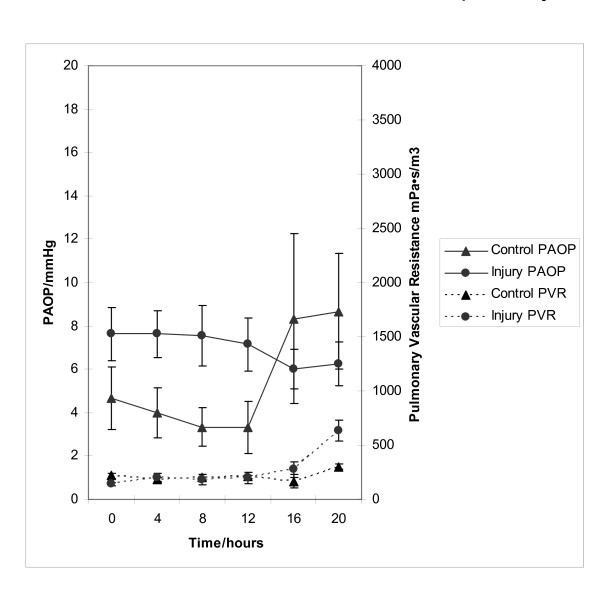
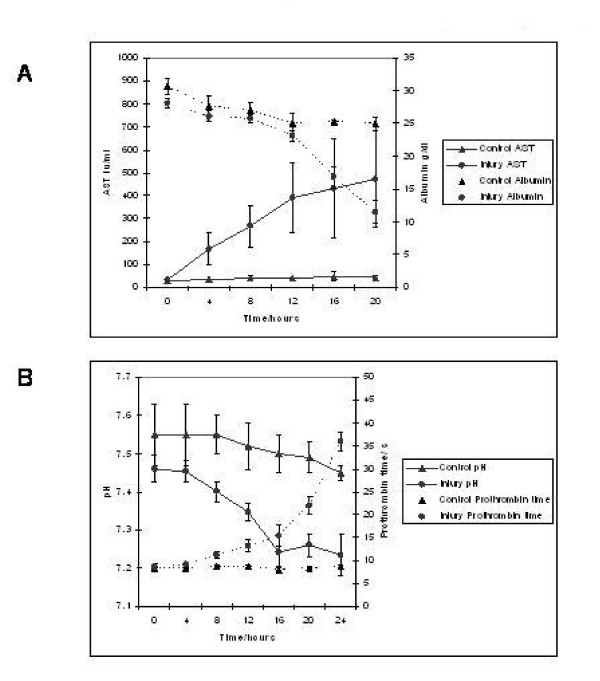
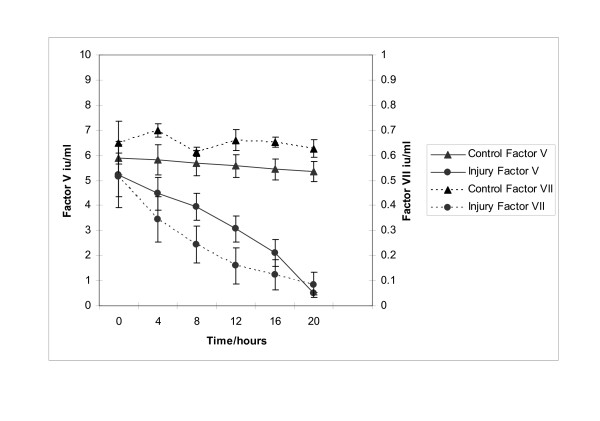
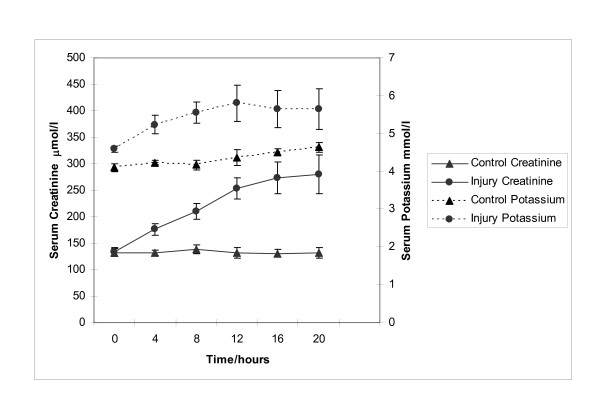
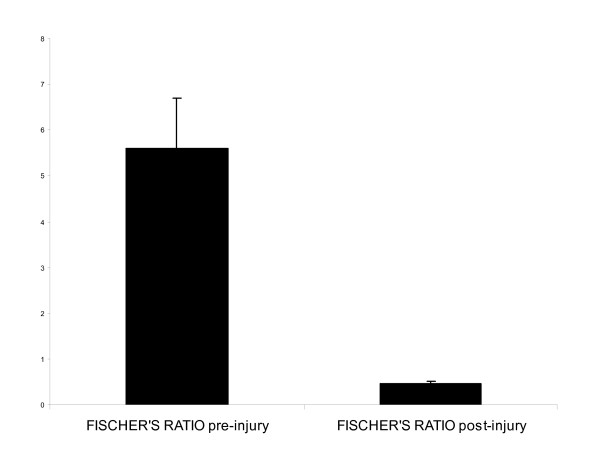
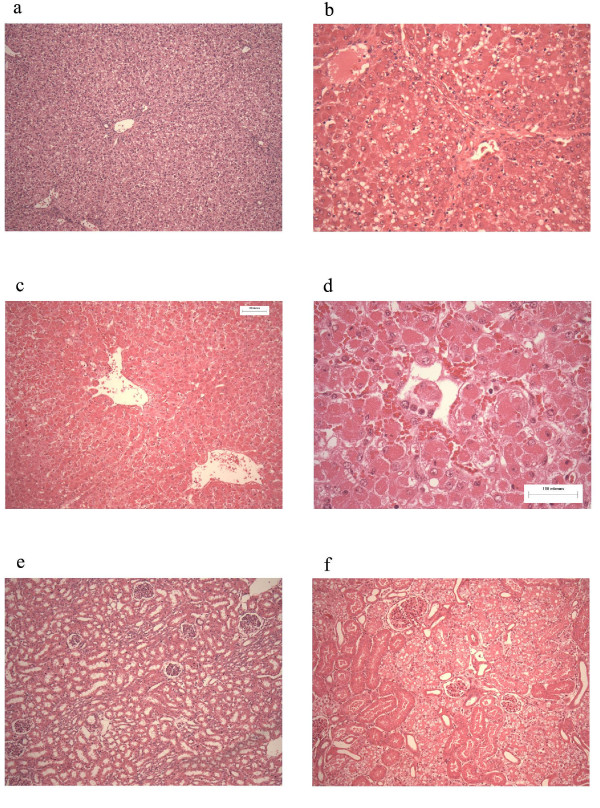
Results: Cytochrome p450 levels in phenobarbital pre-treated animals were significantly higher than non pre-treated animals (300 vs 100 pmol/mg protein). Control pigs (n = 4) survived 28-hour anaesthesia without incident. Of nine pigs that received acetaminophen, four survived 20 hours and two survived 28 hours. Injured animals developed hypotension (mean arterial pressure; 40.8 +/- 5.9 vs 59 +/- 2.0 mmHg), increased cardiac output (7.26 +/- 1.86 vs 3.30 +/- 0.40 l/min) and decreased systemic vascular resistance (8.48 +/- 2.75 vs 16.2 +/- 1.76 mPa/s/m3). Dyspnoea developed as liver injury progressed and the increased pulmonary vascular resistance (636 +/- 95 vs 301 +/- 26.9 mPa/s/m3) observed may reflect the development of respiratory distress syndrome.Liver damage was confirmed by deterioration in pH (7.23 +/- 0.05 vs 7.45 +/- 0.02) and prothrombin time (36 +/- 2 vs 8.9 +/- 0.3 seconds) compared with controls. Factor V and VII levels were reduced to 9.3 and 15.5% of starting values in injured animals. A marked increase in serum AST (471.5 +/- 210 vs 42 +/- 8.14) coincided with a marked reduction in serum albumin (11.5 +/- 1.71 vs 25 +/- 1 g/dL) in injured animals. Animals displayed evidence of renal impairment; mean creatinine levels 280.2 +/- 36.5 vs 131.6 +/- 9.33 mumol/l. Liver histology revealed evidence of severe centrilobular necrosis with coagulative necrosis. Marked renal tubular necrosis was also seen. Methaemoglobin levels did not rise >5%. Intracranial hypertension was not seen (ICP monitoring), but there was biochemical evidence of encephalopathy by the reduction of Fischer's ratio from 5.6 +/- 1.1 to 0.45 +/- 0.06.
Conclusion: We have developed a reproducible large animal model of acetaminophen-induced liver failure, which allows in-depth investigation of the pathophysiological basis of this condition. Furthermore, this represents an important large animal model for testing artificial liver support systems.
Figures
Similar articles
-
Pathophysiological central nervous system changes in a porcine model of acetaminophen-induced acute liver failure.Toxicol Lett. 2017 Nov 5;281:119-126. doi: 10.1016/j.toxlet.2017.09.018. Epub 2017 Sep 27. Toxicol Lett. 2017. PMID: 28958773
-
A reproducible, clinically relevant, intensively managed, pig model of acute liver failure for testing of therapies aimed to prolong survival.Liver Int. 2013 Apr;33(4):544-51. doi: 10.1111/liv.12042. Epub 2013 Jan 20. Liver Int. 2013. PMID: 23331547
-
Artificial liver support in pigs with acetaminophen-induced acute liver failure.World J Gastroenterol. 2017 May 14;23(18):3262-3268. doi: 10.3748/wjg.v23.i18.3262. World J Gastroenterol. 2017. PMID: 28566885 Free PMC article.
-
Gc-globulin in liver disease.Dan Med Bull. 2008 Aug;55(3):131-46. Dan Med Bull. 2008. PMID: 19232164 Review.
-
Acetaminophen-induced nephrotoxicity: pathophysiology, clinical manifestations, and management.J Med Toxicol. 2008 Mar;4(1):2-6. doi: 10.1007/BF03160941. J Med Toxicol. 2008. PMID: 18338302 Free PMC article. Review.
Cited by
-
Profiling the impact of medium formulation on morphology and functionality of primary hepatocytes in vitro.Sci Rep. 2013;3:2735. doi: 10.1038/srep02735. Sci Rep. 2013. PMID: 24061220 Free PMC article.
-
Porcine model characterizing various parameters assessing the outcome after acetaminophen intoxication induced acute liver failure.World J Gastroenterol. 2017 Mar 7;23(9):1576-1585. doi: 10.3748/wjg.v23.i9.1576. World J Gastroenterol. 2017. PMID: 28321158 Free PMC article.
-
Standardized intensive care unit management in an anhepatic pig model: new standards for analyzing liver support systems.Crit Care. 2010;14(4):R138. doi: 10.1186/cc9196. Epub 2010 Jul 22. Crit Care. 2010. PMID: 20649958 Free PMC article.
-
The role of exosomal lncRNAs in acetaminophen-induced induced liver injury in SD rats.Noncoding RNA Res. 2024 May 23;9(4):1190-1202. doi: 10.1016/j.ncrna.2024.05.011. eCollection 2024 Dec. Noncoding RNA Res. 2024. PMID: 39026604 Free PMC article.
-
Pulmonary implications of acetaminophen exposures independent of hepatic toxicity.Am J Physiol Lung Cell Mol Physiol. 2021 Nov 1;321(5):L941-L953. doi: 10.1152/ajplung.00234.2021. Epub 2021 Sep 29. Am J Physiol Lung Cell Mol Physiol. 2021. PMID: 34585971 Free PMC article.
