. 2010 Feb 1;2(2):9.
doi: 10.1186/gm130.

Integration of microRNA changes in vivo identifies novel molecular features of muscle insulin resistance in type 2 diabetes

Affiliations

Integration of microRNA changes in vivo identifies novel molecular features of muscle insulin resistance in type 2 diabetes

Iain J Gallagher et al. Genome Med. .

Abstract

Background: Skeletal muscle insulin resistance (IR) is considered a critical component of type II diabetes, yet to date IR has evaded characterization at the global gene expression level in humans. MicroRNAs (miRNAs) are considered fine-scale rheostats of protein-coding gene product abundance. The relative importance and mode of action of miRNAs in human complex diseases remains to be fully elucidated. We produce a global map of coding and non-coding RNAs in human muscle IR with the aim of identifying novel disease biomarkers.

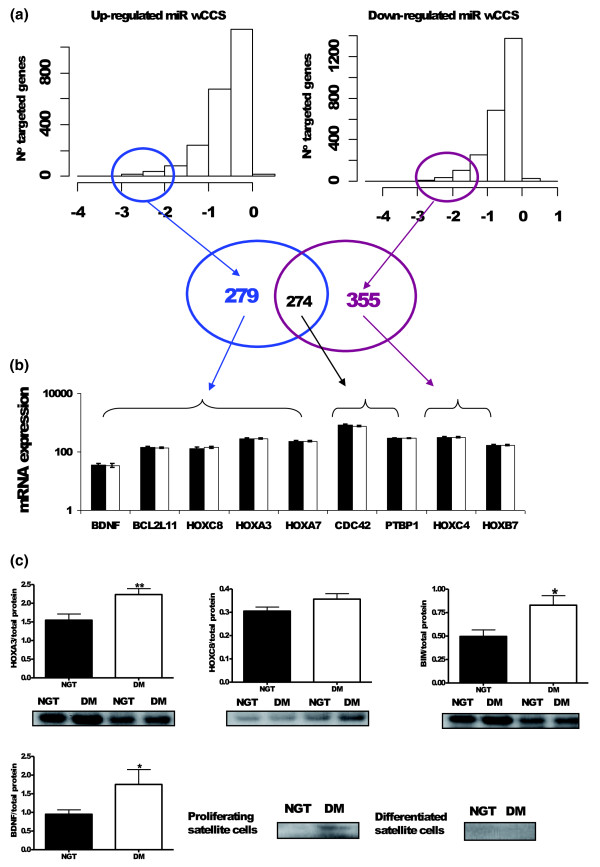
Methods: We profiled >47,000 mRNA sequences and >500 human miRNAs using gene-chips and 118 subjects (n = 71 patients versus n = 47 controls). A tissue-specific gene-ranking system was developed to stratify thousands of miRNA target-genes, removing false positives, yielding a weighted inhibitor score, which integrated the net impact of both up- and down-regulated miRNAs. Both informatic and protein detection validation was used to verify the predictions of in vivo changes.

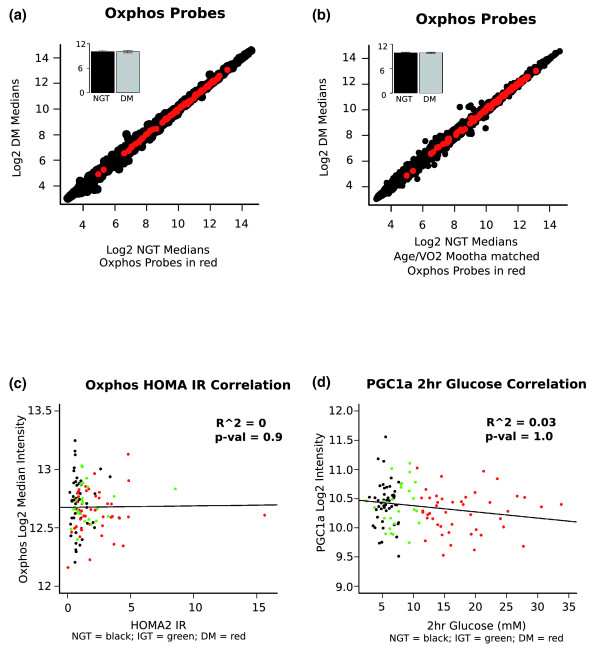
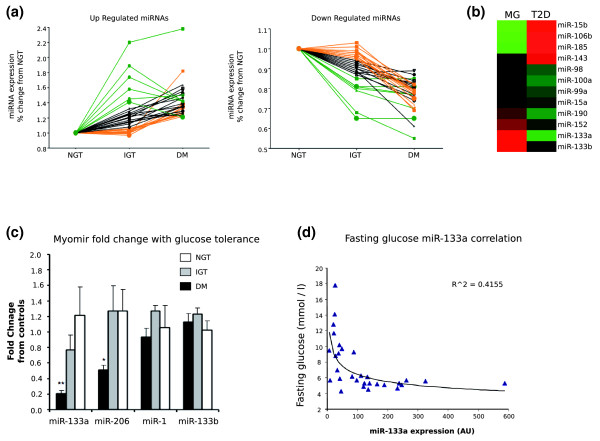
Results: The muscle mRNA transcriptome is invariant with respect to insulin or glucose homeostasis. In contrast, a third of miRNAs detected in muscle were altered in disease (n = 62), many changing prior to the onset of clinical diabetes. The novel ranking metric identified six canonical pathways with proven links to metabolic disease while the control data demonstrated no enrichment. The Benjamini-Hochberg adjusted Gene Ontology profile of the highest ranked targets was metabolic (P < 7.4 x 10⁻⁸), post-translational modification (P < 9.7 x 10⁻⁵) and developmental (P < 1.3 x 10⁻⁶) processes. Protein profiling of six development-related genes validated the predictions. Brain-derived neurotrophic factor protein was detectable only in muscle satellite cells and was increased in diabetes patients compared with controls, consistent with the observation that global miRNA changes were opposite from those found during myogenic differentiation.

Conclusions: We provide evidence that IR in humans may be related to coordinated changes in multiple microRNAs, which act to target relevant signaling pathways. It would appear that miRNAs can produce marked changes in target protein abundance in vivo by working in a combinatorial manner. Thus, miRNA detection represents a new molecular biomarker strategy for insulin resistance, where micrograms of patient material is needed to monitor efficacy during drug or life-style interventions.


Figures

Figure 1
Figure 1
OXPHOS gene expression and relationship to disease status. (a) Plot of median intensity of OXPHOS probes (red circles) for NGT (n = 47) versus T2D (DM; n = 45) on the background of absent filtered probesets (black circles). The insert shows the mean expression of OXPHOS probesets (± standard error of the mean). (b) Plot of median intensity of OXPHOS probes (red circles) for NGT (n = 14) versus T2D (n = 17) on the background of absent filtered probesets (black circles). These subjects have the same physiological characteristics as those in the Mootha et al. study [1]. The insert shows the mean expression of OXPHOS probesets (± standard error of the mean). (c) Correlation plot for HOMA2 insulin resistance (IR) and MAS 5.0 normalized expression values for the OXPHOS probe sets. Each point represents the median expression for an OXPHOS probe set after filtering the Affymetrix data as described above. The subject groups are represented by colored points: black = normal glucose tolerance; green = impaired glucose tolerance; red = type 2 diabetic. The regression line is shown in black along with the R squared value for goodness of fit and the P-value indicating significance of the relationship. (d) The linear correlation between 2 hour blood glucose (during oral glucose tolerance test) and PGC-1α expression (n = 118) in skeletal muscle of subjects across the clinical groups NGT (black-dots), IGT (green-dots) and T2D (red-dots) derived from the Affymetrix probe set. The regression line is shown in black along with the R squared value for goodness of fit and the P-value indicating significance of the relationship.
Figure 2
Figure 2
miRNA expression profile changes in T2D compared with control subjects using the Exiqon chip platform and TaqMan confirmation (FDR <10%). (a) Data are plotted to show the pattern of change of these significantly up-/down-regulated miRNA. Black lines represent those miRNA that increase/decrease progressively with IGT and T2D (DM), green lines represent miRNAs that are increased/decreased with IGT and then revert with T2D, while orange lines show miRNAs increased/decreased only in the T2D state. (b) miRNAs that show the expression profile during myocyte differentiation (cell data derived from Chen et al. [55]) is the opposite pattern to that observed in the muscle of patients with T2D (green = down-regulated probe sets, red = up-regulated probe sets; the color range is from -3-fold to +3-fold change). MG refers to the data produced by Chen et al. during myogenesis. (c)Expression level of miR-1, miR-133a, miR-133b and miR-206 in muscle biopsies from healthy individuals (NGT, n = 10, white bars), individuals with impaired glucose tolerance (IGT, n = 10, grey bars) and individuals with type 2 diabetes (T2D, n = 10, black bars). miR-133a (P < 0.001) and miR-206 (P = 0.04) were significantly reduced in T2D patients when compared with expression levels in healthy controls. Data are expressed as fold change from NGT and shown as mean ± standard error. ** P < 0.001, * P < 0.05. (d) Expression level of miR-133a in muscle versus indices of glucose homeostasis in subjects with and without T2D. Expression of miR-133a is positively correlated with fasting glucose, R2 = 0.41 (P < 0.001, n = 30). Data are shown as ΔCt levels normalized to RNU48 and plotted versus fasting glucose levels (mmol/L).
Figure 3
Figure 3
Generation and validation of a weighted cumulative context score for type 2 diabetes miRNAs. (a) Target genes with a more negative cumulative context score (CCS) are, on average, expressed at a lower level than non-targeted genes (Additional file 2). To determine which genes are most targeted when there is a shift in global miRNA expression, the distribution of CCS was adjusted on a gene by gene basis for the magnitude of up-/down-modulation of [miRNA] - wCCS. As can be seen, despite the vast number of potential predicted targets (Figure S5A in Additional file 1), few target genes have highly scoring wCCSs. There were 279 genes in the first quartile predicted to be up-regulated (reduced regulation by miRNAs) and 355 in the first quartile predicted to be down-regulated (increased regulation by miRNAs). The composition of these lists was validated using pathway and ontology analysis (b). Consistent with the global Affymetrix analysis (Figure S2 in Additional file 1) the mRNA of developmental related first quartile wCCS genes was identical between patients and controls. This was true regardless of whether the gene should be up-regulated (BDNF, BCL2L11(BIM), HOXA3, HOXC8, HOXA7 and HOXB7), down-regulated (HOXC4), or unchanged (CDC42 and PTBP1). This indicates miRNA are operating to block protein translation. Error bars = s.e.m. (c) Proteins highly ranked for being up-regulated were selected and protein expression was analyzed in skeletal muscle biopsies from normal glucose tolerant controls (NGT; n = 6) and subjects with T2D (DM; n = 6). From a second set of subjects, satellite cells were isolated from skeletal muscle biopsies from normal glucose tolerant controls (NGT) (n = 5 to 6) and subjects with T2D (DM; n = 5 to 6). The satellite cells were harvested in a proliferative state or as differentiated into myotubes. Protein expression was analyzed by using western blotting and specific antibodies towards the protein targets. HOXA3 (top left) was detected as a 30 kDa band, significantly up-regulated in muscle from subjects with T2D (P = 0.006). BCL2L11 (BIM; top middle) was detected as a band around 25 kDa, significantly up-regulated in muscle from subjects with T2D (P = 0.014). HOXC8 (top right) was detected as a band around 36 kDa and demonstrated a clear trend for up-regulation (P = 0.07). BDNF (bottom) was detected as a band at 14 kDa, up-regulated in proliferating satellite cells derived from subjects with T2D where it is typically expressed (p = 0.014) but was not expressed in differentiated satellite cells or adult muscle. * = P value < 0.05; ** = P value < 0.001.

References

    1. Mootha VK, Lindgren CM, Eriksson KF, Subramanian A, Sihag S, Lehar J, Puigserver P, Carlsson E, Ridderstrale M, Laurila E, Houstis N, Daly MJ, Patterson N, Mesirov JP, Golub TR, Tamayo P, Spiegelman B, Lander ES, Hirschhorn JN, Altshuler D, Groop LC. PGC-1alpha-responsive genes involved in oxidative phosphorylation are coordinately downregulated in human diabetes. Nat Genet. 2003;34:267–273. doi: 10.1038/ng1180. - DOI - PubMed
    1. Patti ME, Butte AJ, Crunkhorn S, Cusi K, Berria R, Kashyap S, Miyazaki Y, Kohane I, Costello M, Saccone R, Landaker EJ, Goldfine AB, Mun E, DeFronzo R, Finlayson J, Kahn CR, Mandarino LJ. Coordinated reduction of genes of oxidative metabolism in humans with insulin resistance and diabetes: Potential role of PGC1 and NRF1. Proc Natl Acad Sci USA. 2003;100:8466–8471. doi: 10.1073/pnas.1032913100. - DOI - PMC - PubMed
    1. Sreekumar R, Halvatsiotis P, Schimke JC, Nair KS. Gene expression profile in skeletal muscle of type 2 diabetes and the effect of insulin treatment. Diabetes. 2002;51:1913–1920. doi: 10.2337/diabetes.51.6.1913. - DOI - PubMed
    1. Yang X, Pratley RE, Tokraks S, Bogardus C, Permana PA. Microarray profiling of skeletal muscle tissues from equally obese, non-diabetic insulin-sensitive and insulin-resistant Pima Indians. Diabetologia. 2002;45:1584–1593. doi: 10.1007/s00125-002-0905-7. - DOI - PubMed
    1. Kim JA, Wei Y, Sowers JR. Role of mitochondrial dysfunction in insulin resistance. Circ Res. 2008;102:401–414. doi: 10.1161/CIRCRESAHA.107.165472. - DOI - PMC - PubMed