. 2010 Jun 4;285(23):17701-12.
doi: 10.1074/jbc.M109.043976. Epub 2010 Mar 30.

trans-10,cis-12-Conjugated linoleic acid instigates inflammation in human adipocytes compared with preadipocytes

Affiliations

trans-10,cis-12-Conjugated linoleic acid instigates inflammation in human adipocytes compared with preadipocytes

Kristina Martinez et al. J Biol Chem. .

Abstract

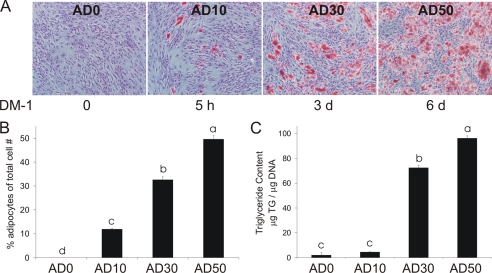
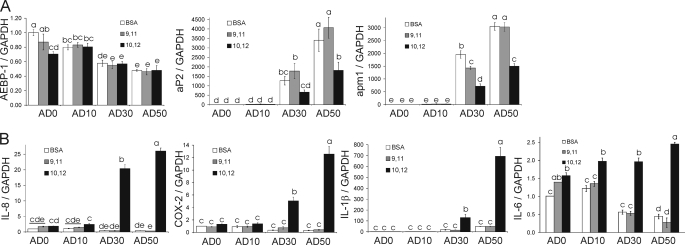
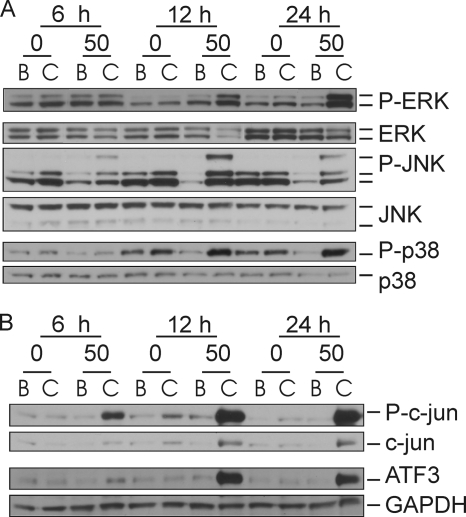
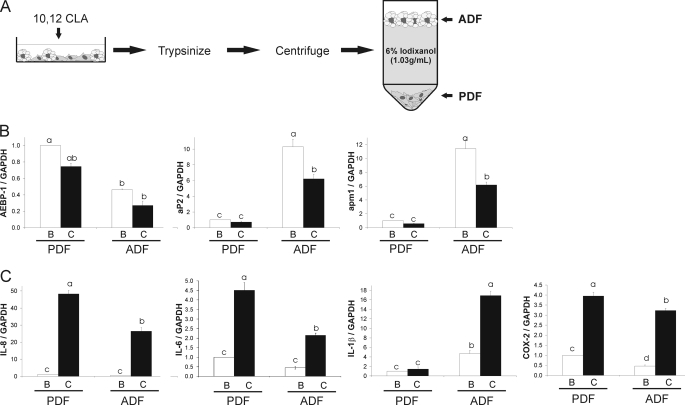
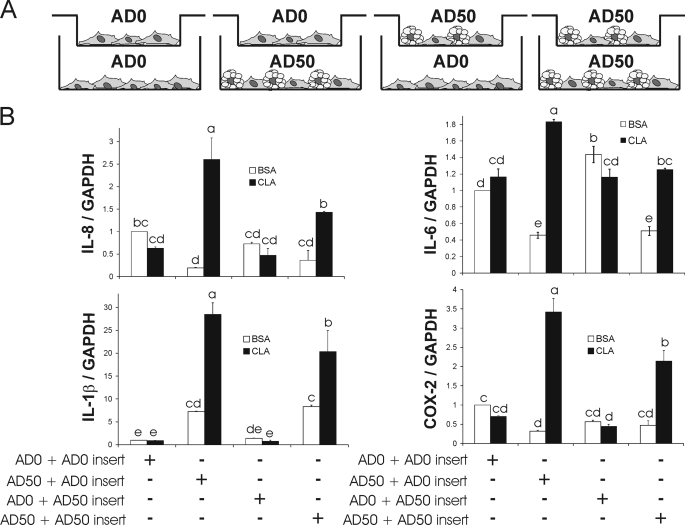
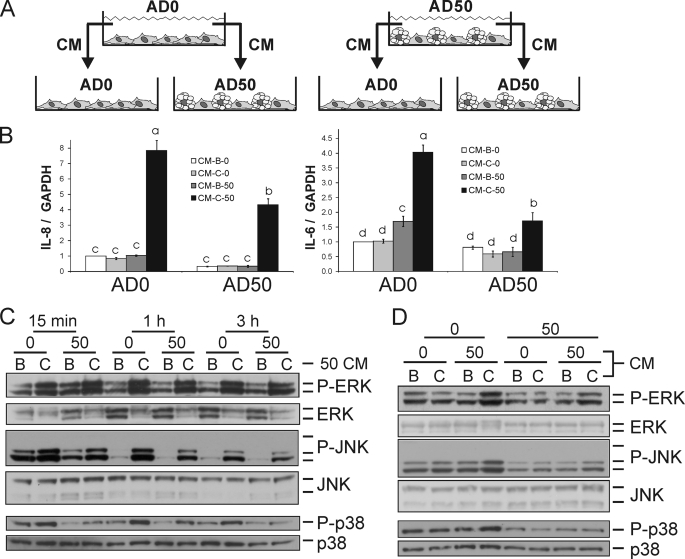
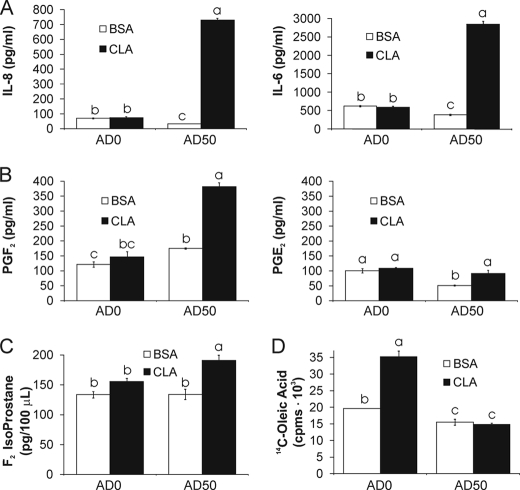
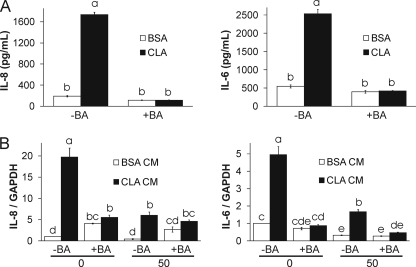
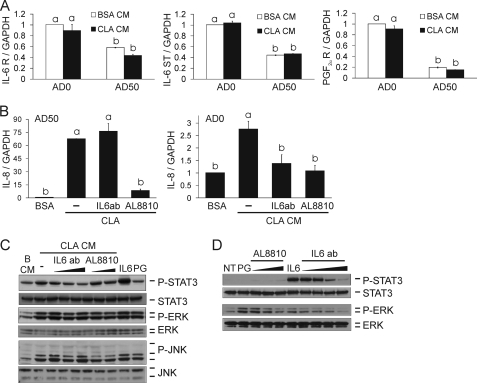
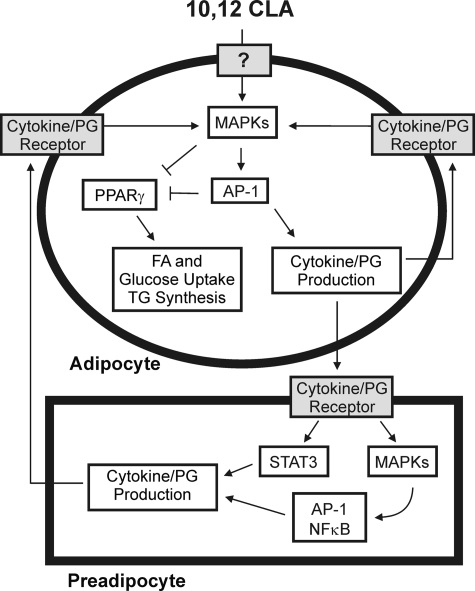
We showed previously in cultures of primary human adipocytes and preadipocytes that lipopolysaccharide and trans-10,cis-12-conjugated linoleic acid (10,12-CLA) activate the inflammatory signaling that promotes insulin resistance. Because our published data demonstrated that preadipocytes are the primary instigators of inflammatory signaling in lipopolysaccharide-treated cultures, we hypothesized that they played the same role in 10,12-CLA-mediated inflammation. To test this hypothesis, we employed four distinct models. In model 1, a differentiation model, CLA activation of MAPK and induction of interleukin-8 (IL-8), IL-6, IL-1beta, and cyclo-oxygenase-2 (COX-2) were greatest in differentiated compared with undifferentiated cultures. In model 2, a cell separation model, the mRNA levels of these inflammatory proteins were increased by 10,12-CLA compared with bovine serum albumin vehicle in the adipocyte fraction and the preadipocyte fraction. In model 3, a co-culture insert model, inserts containing approximately 50% adipocytes (AD50) or approximately 100% preadipocytes (AD0) were suspended over wells containing AD50 or AD0 cultures. 10,12-CLA-induced IL-8, IL-6, IL-1beta, and COX-2 mRNA levels were highest in AD50 cultures when co-cultured with AD0 inserts. In model 4, a conditioned medium (CM) model, CM collected from CLA-treated AD50 but not AD0 cultures induced IL-8 and IL-6 mRNA levels and activated phosphorylation of MAPK in naive AD0 and AD50 cultures. Consistent with these data, 10,12-CLA-mediated secretions of IL-8 and IL-6 from AD50 cultures were higher than from AD0 cultures. Notably, blocking adipocytokine secretion prevented the inflammatory capacity of CM from 10,12-CLA-treated cultures. These data suggest that CLA instigates the release of inflammatory signals from adipocytes that subsequently activate adjacent preadipocytes.


Figures

FIGURE 1.
FIGURE 1.
The percentage of lipid-filled adipocytes increases with the duration of DM-1 supplementation. Four human (pre)adipocyte cell models containing ∼ 0, 10, 30, and 50% adipocytes were established by modulating exposure to DM-1. AD0 cultures received no DM-1 for 8 d AD10, AD30, and AD50 cultures were supplemented with DM-1 containing 1 μm BRL and 250 μm isobuthylmethylxanthine for 5 h, 3 d, or 6 d, respectively. A, on days 9 and 10, cells were fixed with Baker's formalin, stained with ORO to detect adipocytes, and counterstained with Mayer's hematoxylin to detect nondifferentiated cells. Three pictures/well were taken, each of a different field. B, the total number of cells stained with ORO was counted and expressed as a percentage of total cell number. C, TG content was determined using a colorimetric assay. Data are expressed as μg of TG/μg of DNA. The data in A–C are representative of three independent experiments. Means ± S.E. not sharing a common superscript (a–d) differ significantly (p < 0.05).
FIGURE 2.
FIGURE 2.
10,12-CLA-induction of inflammatory gene expression increases as the degree of differentiation increases. Using the differentiation model, each experimental group (i.e. AD0, AD10, AD30, and AD50) was treated with BSA vehicle, 50 μm 10,12-CLA, or 50 μm 9,11-CLA as a positive control for 12 h. A, cells were harvested for RNA extraction, and mRNA analyses were done via qPCR on day 9 for subsequent marker gene analyses to verify increases in adipocyte number with increasing duration of DM-1 treatment. B, inflammatory genes increased by 10,12-CLA compared with 9,11-CLA and BSA controls. Data were normalized to BSA vehicle in AD0 cultures. Means ± S.E. (n = 3) not sharing a common superscript (a–e) are significantly different (p < 0.05). The data in both panels are representative of three independent experiments.
FIGURE 3.
FIGURE 3.
Time-dependent increase in the activation of MAPK and transcription factors in AD50 versus AD0 cultures treated with 10,12-CLA. AD0 and AD50 cultures were treated with 50 μm 10,12-CLA (C lanes) or BSA (B lanes) control for 6, 12, or 24 h. Cells were harvested and analyzed for protein expression via immunoblot. Membranes were probed with antibodies targeting phosphorylated and total ERK, JNK, and p38 (A) and P-c-Jun, c-Jun, ATF3, and GAPDH (n = 2) (B). The data in both panels are representative of three independent experiments.
FIGURE 4.
FIGURE 4.
10,12-CLA induces inflammatory gene expression in the PDF and ADF fractions of newly differentiated primary human adipocytes. A, human SV cells were supplemented with DM-1 for 3 d yielding cultures containing ∼30% adipocytes (AD30). Cultures were treated with 50 μm 10,12-CLA or BSA vehicle for 12 h and then fractionated using 6% iodixanol (1.03 g/ml). The lipid-laden ADF was floated, and the PDF was pelleted. B, fractionations were verified by measuring gene expression of AEBP-1, aP2, GAPDH and apm1 using qPCR. C, relative mRNA expression of IL-8, IL-1β, COX-2, GAPDH and ATF3 were investigated using qPCR. Data in B and C were normalized to BSA vehicle in the PDF. Means ± S.E. (n = 3) not sharing a common superscript (a–d) differ significantly (p < 0.05). The data in B and C are representative of three independent experiments.
FIGURE 5.
FIGURE 5.
10,12-CLA-induced inflammatory gene expression is greatest in AD50 cultures in the presence of AD0-containing inserts. A, inserts containing either preadipocytes (AD0) or preadipocytes and adipocytes (AD50) were suspended over 6-well plates containing either AD0 or AD50 cultures. B, next, both wells and inserts were supplemented with 50 μm 10,12-CLA or BSA vehicle control for 12 h, and inflammatory gene expression in the cells in the underlying wells was subsequently analyzed via qPCR. Means ± S.E. (n = 3) not sharing a common superscript (a–e) differ significantly (p < 0.05). The data are representative of two independent experiments.
FIGURE 6.
FIGURE 6.
CM from 10,12-CLA-treated AD50 cultures induces inflammatory genes and activates MAPK in naive AD0 and AD50 cultures. A, CM was collected from AD0 and AD50 cultures that were treated with 50 μm 10,12-CLA or BSA control for 24 h. A 1:1 ratio of CM to AM-1 was added to AD0 and AD50 cultures. B, next, cultures were treated with CM for 3 h and inflammatory genes and GAPDH were analyzed via qPCR. Means ± S.E. (n = 4) not sharing a common superscript (a–d) differ significantly (p < 0.05). C, AD0 and AD50 cultures were treated with AD50 CM for 15 min, 1 h, and 3 h. D, AD0 cultures were treated with AD50 and AD0 CM for 15 min. C and D, cells were harvested and analyzed for protein expression via immunoblotting. Membranes were probed with antibodies targeting phosphorylated and total ERK, JNK, and p38 (n = 2). AD0 or AD50 cultures were treated with CM collected from BSA or CLA-treated AD0 or AD50 cultures for 3 h (B). Next, gene expression was analyzed. AD0 and AD50 cultures were treated with CM collected from BSA or CLA-treated cultures for 15 min, 1 h, or 3 h (C). The data in B–D are representative of three independent experiments.
FIGURE 7.
FIGURE 7.
10,12-CLA-treated AD50 cultures secrete adipocytokines and PGF2. Cells were treated with 50 μm 10,12-CLA or BSA control for 24 h. A, CM was collected, and IL-8 and IL-6 were measured in CM using the Bio-Rad BioPlex suspension array system. B, CM was collected, and PGF2 and PGE2 were measured using a stable isotope dilution GC/NICI/MS assay. C, cells were harvested in phosphate-buffered saline and total F2-isoprostanes were measured using GC/MS with selective ion monitoring. D, AD0 and AD50 cultures were treated with 20 μl of HBSS containing 12.5 nm [14C]oleic acid (0.2 μCi; specific activity = 40–60 mCi/mmol) for 12 h. The medium was removed, and cells were washed three times with HBSS containing 2% BSA. Subsequently, each well was treated with 250 μl of Dulbecco's modified Eagle's medium containing 50 μm 10,12-CLA or BSA + phloretin (a fatty acid uptake inhibitor) for 9 h. 200 μl of the medium was collected from each well and measured for [14C]oleic acid by scintillation counting. Means ± S.E. (A–C, n = 4; D, n = 3) not sharing a common superscript (a–c) differ significantly (p < 0.05). The data in A–C and in D are representative of two and three independent experiments, respectively.
FIGURE 8.
FIGURE 8.
Brefeldin A (BA) prevents CM from 10,12-CLA AD50 cultures from inducing inflammatory gene expression. AD50 cultures were pretreated with 1 μg/ml brefeldin A for 1 h to prevent cytokine secretion and treated with 50 μm CLA or BSA for 24 h. A, IL-8 and IL-6 were measured in CM using the Bio-Rad suspension array system. B, CM was collected, and 1 ml was added to naive AD0 or AD50 cultures containing 1 ml of AM-1 (1:1 ratio) for 3 h; cells were harvested to measure inflammatory gene expression via qPCR. Means ± S.E. (A, n = 2; B, n = 3) not sharing a common superscript (a–e) differ significantly (p < 0.05). The data in A and B are representative of two and three independent experiments, respectively.
FIGURE 9.
FIGURE 9.
IL-6-neutralizing Ab, PGF analog, and FP prostanoid receptor antagonist AL-8810 attenuate CLA CM-induced IL-8 gene expression and P-STAT3 levels. A, AD0 and AD50 cultures treated with BSA or CLA CM at a 1:1 ratio of CM to AM-1 for 3 h were analyzed for IL-6 receptor (R), IL-6 signal transducer (ST), GAPDH, and PGF receptor expression via qPCR. B, AD50 cultures were pretreated with 0.01 μg/ml IL-6 Ab or 50 μm AL-8810 for 30 min and then treated with 50 μm 10,12-CLA or BSA vehicle for 24 h after which IL-8 mRNA levels were measured. Next, AD0 cultures were treated with AD50 CM for 3 h, and IL-8 mRNA levels were measured. C, AD50 cultures were pretreated with 0.01, 0.1, and 1 μg/ml IL-6 Ab or 1 and 10 μm AL-8810 for 30 min. Then cultures were treated with 50 μm 10,12-CLA or BSA vehicle for 24 h after which CM was collected and added to AD0 cultures for 1 h. Cultures were treated with 0.1 μg/ml recombinant human IL-6 and 10 μm PGF (PG) for 30 min as positive controls. D, AD0 cultures were untreated (NT) or pretreated with 0.01, 0.1, 1, or 10 μg/ml IL-6 Ab or 0.5, 5, or 50 μm AL-8810 for 30 min and then treated with 0.1 μg/ml recombinant human IL-6 or 10 μm PGF for 30 min, respectively. C and D, cells were harvested and analyzed for levels of phosphorylated and total STAT3, ERK, or JNK via immunoblotting. Means ± S.E. (A, n = 3; B–D, n = 2–3) not sharing a common superscript (a–b) differ significantly (p < 0.05). The data in all panels are representative of three independent experiments. NT, no treatment; PG, PGF2α.
FIGURE 10.
FIGURE 10.
Working model. Treating primary cultures of newly differentiated human adipocytes with 10,12-CLA increases the phosphorylation of MAPK (i.e. ERK 1/2, JNK, and p38) and the activation of the transcription factor AP-1 (i.e. c-Jun, c-Fos, ATF2, and ATF3), which leads to the production of inflammatory cytokines and PGs (i.e. PGE2 and PGF2) through up-regulation of inflammatory genes (i.e. COX-2, IL-1β, IL-8, and ATF3). These inflammatory signals subsequently activate preadipocytes leading to inflammatory cytokine secretion from preadipocytes, thus continuing the inflammatory cycle. Furthermore, activation of STAT3, MAPK, and AP-1 by 10,12-CLA antagonizes PPARγ and associated target genes, ultimately leading to delipidation through decreased glucose and fatty acid uptake and decreased TG content in adipocytes.

Similar articles

Cited by

References

    1. Khan L., Sobush K., Keener D., Goodman K., Lowry A., Kakietek J., Zaro S. (2009) MMWR Recomm. Rep. 58, 1–26 - PubMed
    1. Park Y., Storkson J. M., Albright K. J., Liu W., Pariza M. W. (1999) Lipids 34, 235–241 - PubMed
    1. Terpstra A. H., Beynen A. C., Everts H., Kocsis S., Katan M. B., Zock P. L. (2002) J. Nutr. 132, 940–945 - PubMed
    1. Bhattacharya A., Rahman M. M., Sun D., Lawrence R., Mejia W., McCarter R., O'Shea M., Fernandes G. (2005) J. Nutr. 135, 1124–1130 - PubMed
    1. Poirier H., Shapiro J. S., Kim R. J., Lazar M. A. (2006) Diabetes 55, 1634–1641 - PubMed

Publication types