. 2010 Jun 15;19(12):2445-55.
doi: 10.1093/hmg/ddq127. Epub 2010 Mar 30.

Inhibiting the ubiquitin-proteasome system leads to preferential accumulation of toxic N-terminal mutant huntingtin fragments

Affiliations

Inhibiting the ubiquitin-proteasome system leads to preferential accumulation of toxic N-terminal mutant huntingtin fragments

Xiang Li et al. Hum Mol Genet. .

Abstract

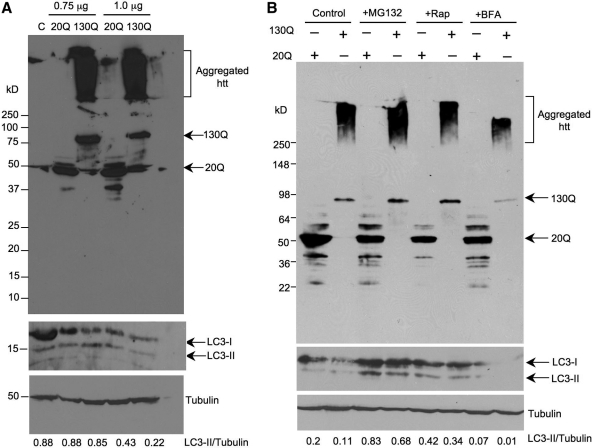
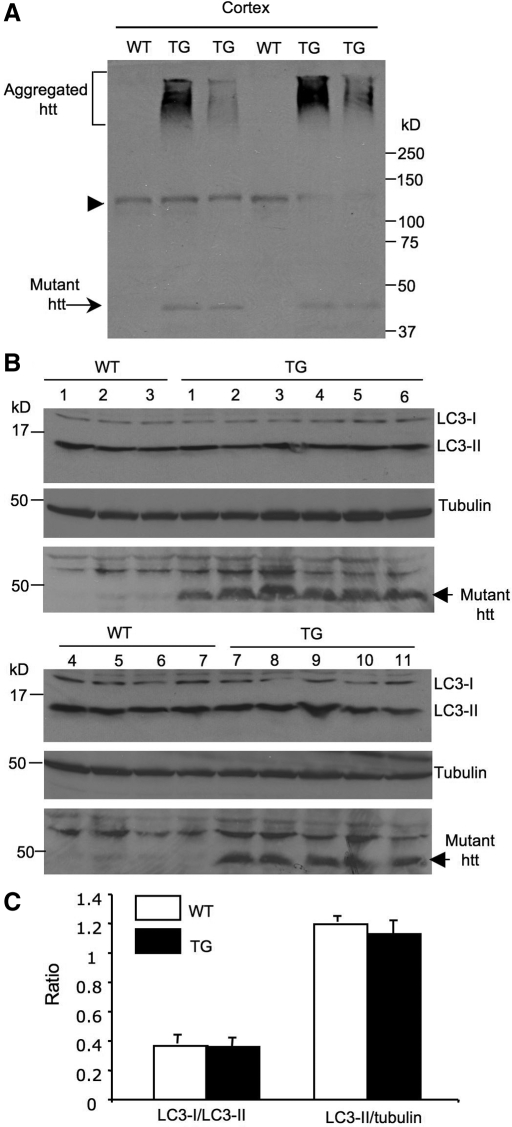
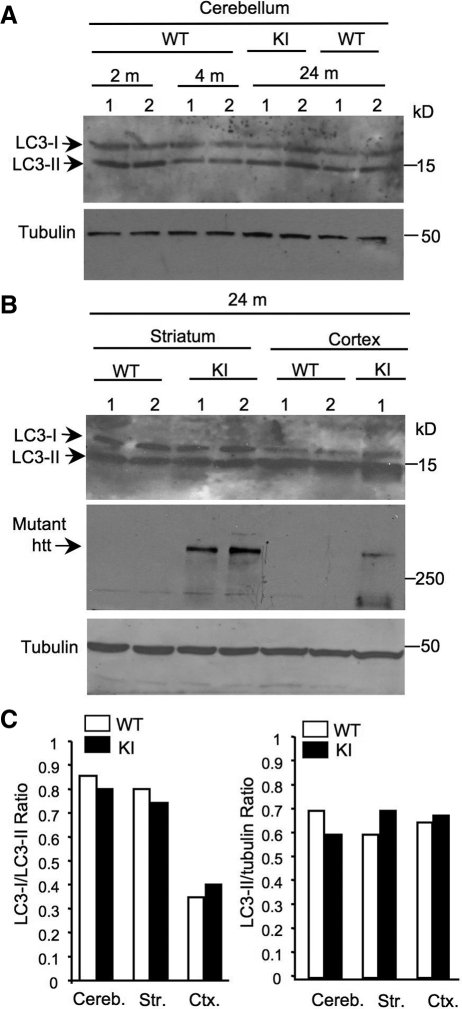
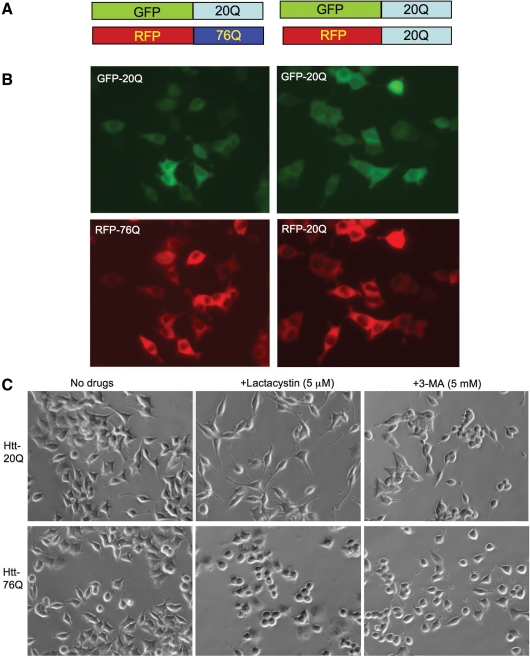
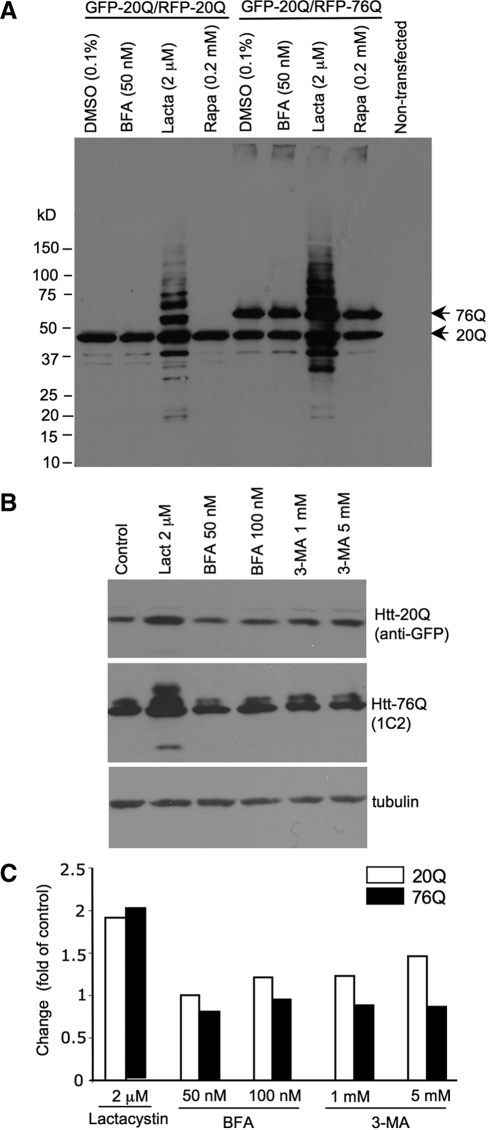
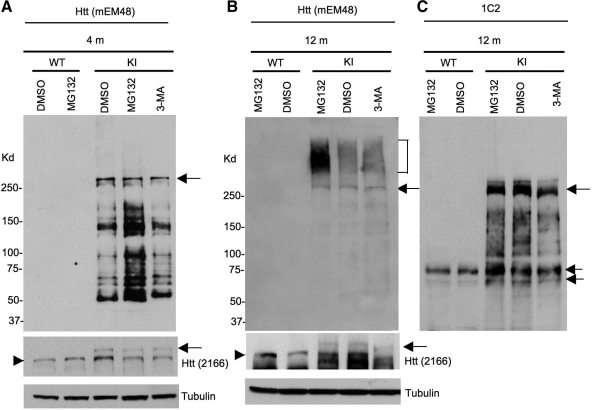
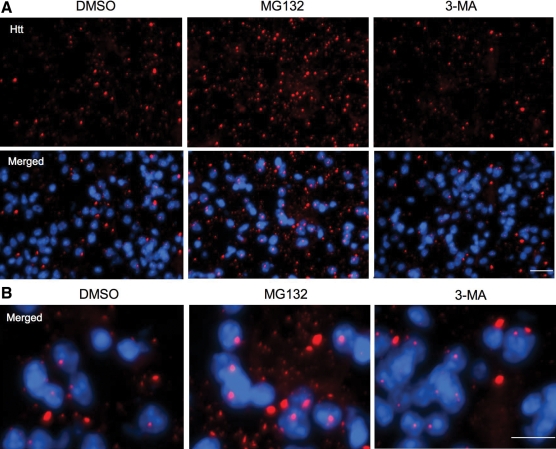
An expanded polyglutamine (polyQ) domain in the N-terminal region of huntingtin (htt) causes misfolding and accumulation of htt in neuronal cells and the subsequent neurodegeneration of Huntington's disease (HD). Clearing the misfolded htt is critical for preventing neuropathology, and this process is mediated primarily by both the ubiquitin-proteasome system (UPS) and autophagy. Although overexpression of mutant htt can inhibit UPS activity in cultured cells, mutant htt does not inhibit global UPS activity in the brains of HD transgenic mice. These findings underscore the importance of investigating the function of the UPS and autophagy in the brain when mutant proteins are not overexpressed. When cultured PC12 cells were treated with either UPS or autophagy inhibitors, more N-terminal mutant htt fragments accumulated via inhibition of the UPS. Furthermore, in HD CAG repeat knock-in mouse brain, inhibiting the UPS also resulted in a greater accumulation of N-terminal, but not full-length, mutant htt than inhibiting autophagy did. Our findings suggest that impairment of the UPS may be more important for the accumulation of N-terminal mutant htt and might therefore make an attractive therapeutic target.


Figures

Figure 1.
Figure 1.
LC3 conversion in cultured HEK293 cells transfected with htt. (A) HEK293 cells were transfected with PRK-GFP-exon1 htt containing 20Q or 130Q at 0.75 or 1.0 µg. Total cell lysates were collected after 24 h transfection for western blotting with antibodies to htt (mEM48), LC3 (NB100-2331) and tubulin. Representative western blots are presented and the ratios of LC3-II to tubulin are shown below the blots. (B) HEK293 cells transfected with GFP-htt exon 1-20Q or GFP-exon1 htt-130Q were treated with the UPS inhibitor MG132 (10 µm) or the autophagy inhibitor brefeldin A (BFA) (100 nm) for 15 h. The cell lysates of the above drug-treated cells were analyzed by western blotting with anti-htt (mEM48) (upper panel). The same blot was then probed with anti-LC3 to reveal LC3 conversion by the above drugs (middle panel). The blot was also probed with anti-tubulin (bottom panel), and the ratios of LC3-II to tubulin are indicated under the blot. Note that MG132 increased the level of soluble mutant htt (130Q) and aggregated htt. The autophagy activator rapamycin (Rap) did not alter the extent of htt aggregation, although the treatment increases the ratio of LC3-II to tubulin. BFA appeared to reduce the expression of LC3 and mutant htt as well as its aggregation.
Figure 2.
Figure 2.
LC3 conversion is not altered in the brain of N171-82Q mice. (A) Western blot analysis of the brain cortex of wild-type (WT) and N171-82Q (TG) mice at the age of 3–4 months. The samples were probed with mEM48 to verify the expression of mutant htt in HD transgenic mice. Arrow indicates soluble mutant htt and bracket indicates aggregated htt. Arrowhead indicates nonspecific bands. (B) Western blot analysis of LC3-I and LC3-II levels in the brain cortex of 7 wild-type (WT) and 11 N171-82Q (TG) mice at 3–4 months of age (upper panel). The blots were also probed with the antibody to tubulin (middle panel). The same samples were also probed with the 1C2 antibody to reveal the expression of transgenic htt (low panel). (C) The ratios of LC3-I to LC3-II and LC3-II to tubulin are shown. There is no statistical significance (P > 0.19) between WT and TG mice.
Figure 3.
Figure 3.
LC3 conversion is not altered in the brain of HD knock-in mice. (AB) Representative western blots showing the expression of LC3 in the cerebellum (A), cortex and striatum (B) of wild-type (WT) and HD CAG150 knock-in (KI) mice at the age of 2, 4 and 24 months. 1C2 was also used to verify the expression of mutant htt (arrow) in KI mice (middle panel in B). (C) The ratios of LC3-I to LC3-II and LC3-II to tubulin are shown. The data were obtained from three to four mice per group. Cereb., cerebellum; Str., striatum; Ctx, cortex.
Figure 4.
Figure 4.
Coexpression of exon1 htt with a normal (20Q) or expanded (76Q) polyQ domain in stably transfected PC12 cells. (A) DNA structures of GFP- or RFP-fused exon1 htt that contains either 20Q or 76Q. (B) Fluorescent microscopy showing the expression of both GFP- and RFP-htt corresponding to htt constructs in (A) in the same PC12 cells. (C) Cell morphology of stably transfected PC12 cells showing that cells expressing RFP-htt-76Q (E12 line) failed to respond to lactacystin treatment to extend long neurites, compared with the control cells expressing GFP-htt-20Q.
Figure 5.
Figure 5.
UPS inhibition leads to a greater increase of transfected htt than autophagy inhibition does. (A) Western blot analysis of the levels of transfected htt after various drug treatments for 15 h. Mutant htt (76Q) and normal htt (20Q) are indicated. Note that lactacystin caused more transfected htt to accumulate than other drugs. (B) The cell lysates of stably transfected cells were probed by anti-GFP to reveal the level of normal htt (20Q) or probed by 1C2 to reveal mutant htt (76Q). The same samples were also probed with antibody to tubulin. (C) The changes in the levels of transfected htt in PC12 cells after drug treatments. The control is cells treated with the drug vehicle DMSO. Densitometry analysis of the htt levels was used to obtain the fold of control for htt levels in cells that were treated with drugs, as indicated.
Figure 6.
Figure 6.
The UPS inhibitor MG132 selectively increases the levels of degraded htt products in the striatum of HD CAG140 knock-in mice. One microliter of vehicle DMSO, MG132 (100 µm) or 3-MA (100 mm) was microinjected into the striatum of wild-type (WT) or HD CAG140 knock-in (KI) mice at 4 or 12 months of age. After 24 h, the striatum was isolated for western blotting with mEM48 (AB), which reacts with polyQ-expanded human htt and its aggregates but is unable to detect normal mouse htt. The blot of 12-month mouse brain samples was also probed by 1C2 (C), which selectively reacts with expanded polyQ and detected soluble (double arrows) and oligomerized, but not aggregated, mutant htt on the blot. Full-length mutant htt was also detected by the mouse antibody 2166 or 1C2 and is indicated by arrows. Endogenous mouse htt is indicated by arrowheads. Aggregated htt is indicated by the bracket. An increased amount of degraded htt fragments was seen in the striatum of 4-month-old HD KI mice after MG132 injection (A). Note that in old HD KI mice at 12 months of age (B), aggregated htt is predominantly seen and also increased by MG132. Two male mice of each group were examined.
Figure 7.
Figure 7.
Immunofluorescent staining of the striatal sections of the 12-month-old HD KI mouse brain. The striatum of HD KI mice was injected with DMSO, the UPS inhibitor MG132, or the autophagy inhibitor 3-MA. After 24 h, the striatal sections were isolated and fixed for immunofluorescent staining with the antibody to htt (mEM48) and Hoechst dye to label nucleus (blue). Note that mutant htt forms nuclear inclusions and neuropil aggregates that are small and outside the nucleus. MG132, but not 3-MA, increased the density of htt aggregates seen in the low (A) and high (B) magnification images. Scale bars: 20 µm in (A) and 10 µm in (B). Two female mice each group were examined.

References

    1. Li X., Li H., Li X.J. Intracellular degradation of misfolded proteins in polyglutamine neurodegenerative diseases. Brain Res. Rev. 2008;59:245–252. doi:10.1016/j.brainresrev.2008.08.003. - DOI - PMC - PubMed
    1. Heng M.Y., Detloff P.J., Albin R.L. Rodent genetic models of Huntington disease. Neurobiol. Dis. 2008;32:1–9. doi:10.1016/j.nbd.2008.06.005. - DOI - PubMed
    1. Ratovitski T., Nakamura M., D'Ambola J., Chighladze E., Liang Y., Wang W., Graham R., Hayden M.R., Borchelt D.R., Hirschhorn R.R., et al. N-terminal proteolysis of full-length mutant huntingtin in an inducible PC12 cell model of Huntington's disease. Cell Cycle. 2007;6:2970–2981. - PubMed
    1. Landles C., Sathasivam K., Weiss A., Woodman B., Moffitt H., Finkbeiner S., Sun B., Gafni J., Ellerby L.M., Trottier Y., et al. Proteolysis of mutant huntingtin produces an exon 1 fragment that accumulates as an aggregated protein in neuronal nuclei in Huntington's disease. J. Biol. Chem. 285:8808–8823. - PMC - PubMed
    1. DiFiglia M., Sapp E., Chase K.O., Davies S.W., Bates G.P., Vonsattel J.P., Aronin N. Aggregation of huntingtin in neuronal intranuclear inclusions and dystrophic neurites in brain. Science. 1997;277:1990–1993. doi:10.1126/science.277.5334.1990. - DOI - PubMed

Publication types

MeSH terms