. 2010 Mar;22(3):606-22.
doi: 10.1105/tpc.109.072843. Epub 2010 Mar 30.

F-box proteins FKF1 and LKP2 act in concert with ZEITLUPE to control Arabidopsis clock progression

Affiliations

F-box proteins FKF1 and LKP2 act in concert with ZEITLUPE to control Arabidopsis clock progression

Antoine Baudry et al. Plant Cell. 2010 Mar.

Abstract

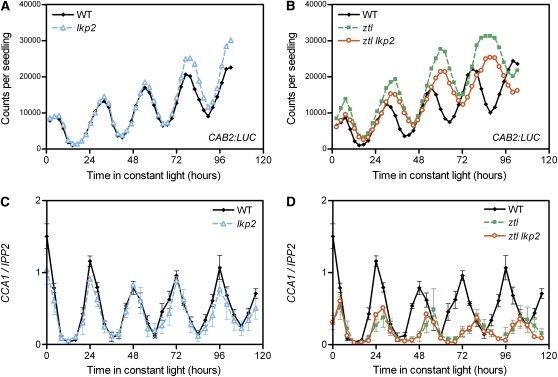
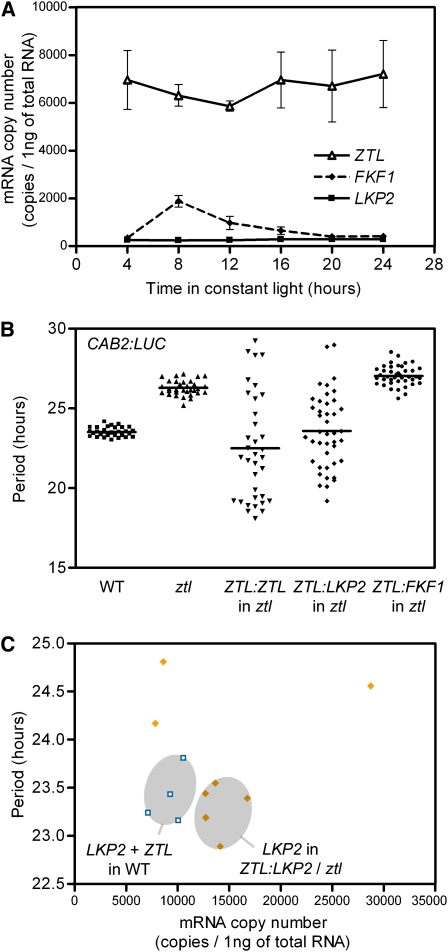
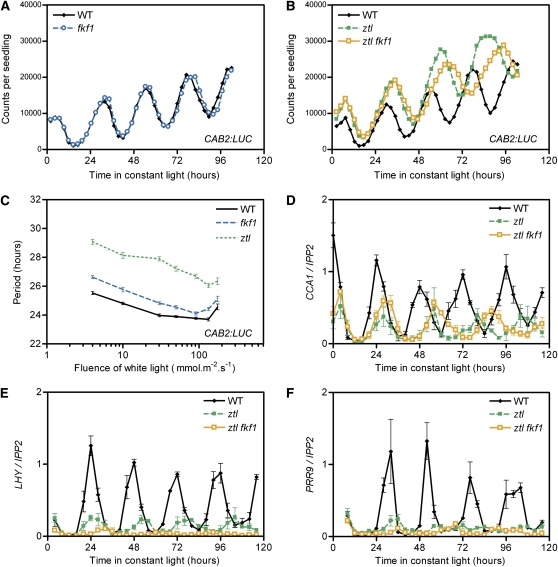
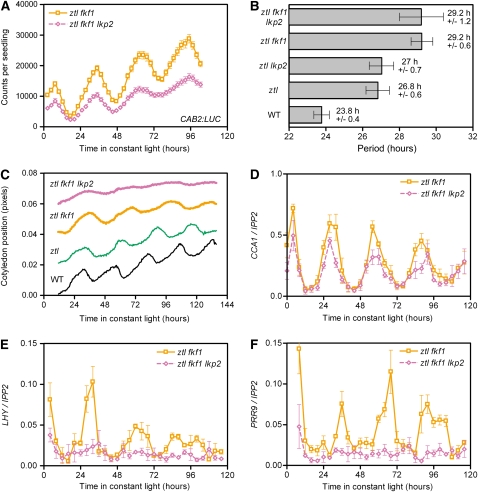
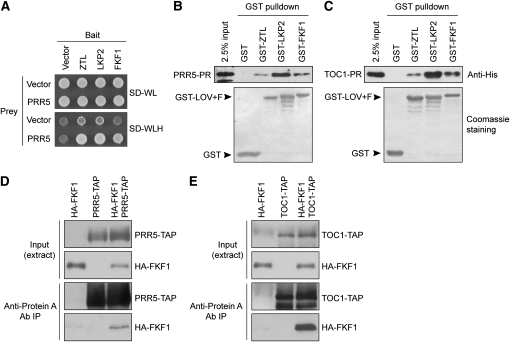
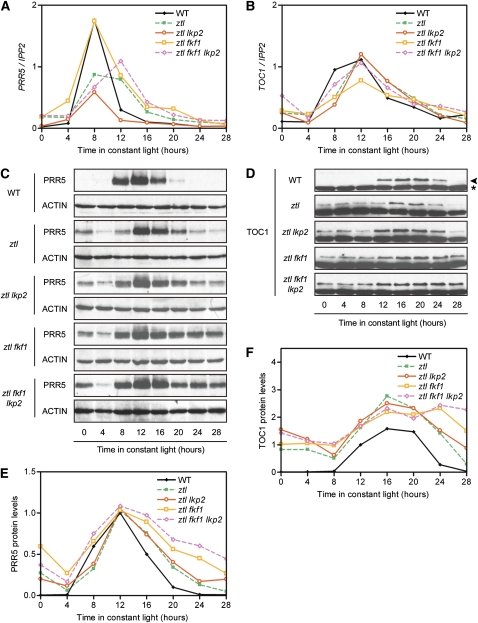
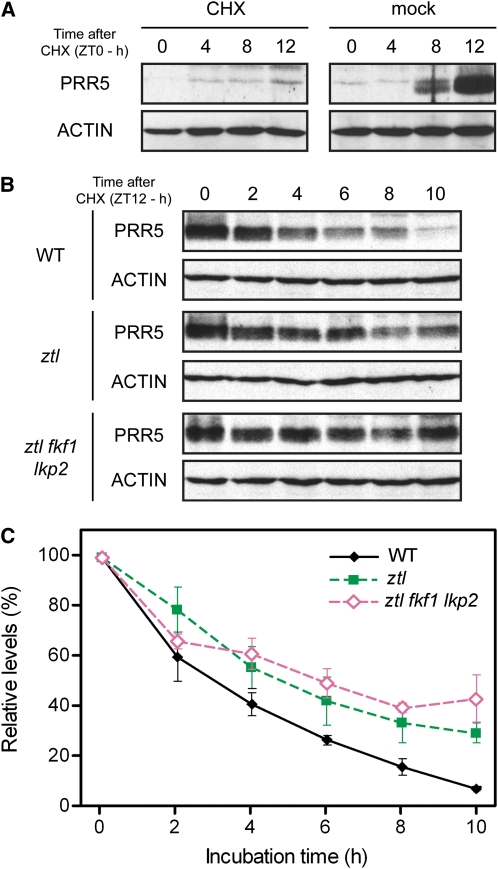
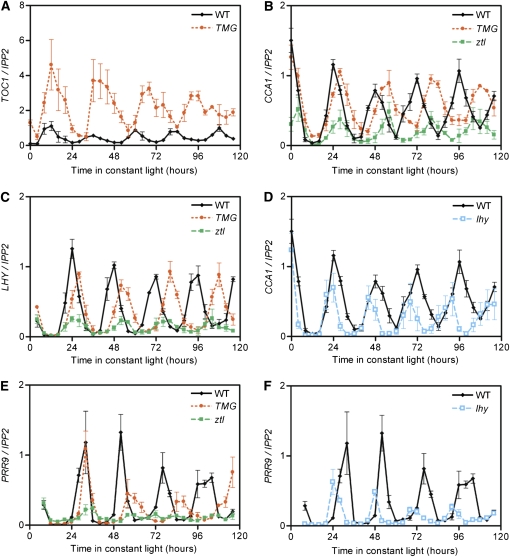
Regulation of protein turnover mediated by ZEITLUPE (ZTL) constitutes an important mechanism of the circadian clock in Arabidopsis thaliana. Here, we report that FLAVIN BINDING, KELCH REPEAT, F-BOX1 (FKF1) and LOV KELCH PROTEIN2 (LKP2) play similar roles to ZTL in the circadian clock when ZTL is absent. In contrast with subtle circadian clock defects in fkf1, the clock in ztl fkf1 has a considerably longer period than in ztl. In ztl fkf1 lkp2, several clock parameters were even more severely affected than in ztl fkf1. Although LATE ELONGATED HYPOCOTYL (LHY) and CIRCADIAN CLOCK ASSOCIATED1 (CCA1) expression levels are lower in ztl than in the wild type, introducing both fkf1 and lkp2 mutations into the ztl mutant dramatically diminished LHY expression without further affecting CCA1 expression. This demonstrates different contributions of ZTL, FKF1, and LKP2 in the regulation of LHY and CCA1 expression. In addition, FKF1 and LKP2 also interacted with TIMING OF CAB EXPRESSION1 (TOC1) and PSEUDO-RESPONSE REGULATOR5 (PRR5), and both proteins were further stabilized in ztl fkf1 and ztl fkf1 lkp2 compared with in ztl. Our results indicate that ZTL, FKF1, and LKP2 together regulate TOC1 and PRR5 degradation and are major contributors to determining the period of circadian oscillation and enhancing robustness.


Figures

Figure 1.
Figure 1.
Analysis of lkp2 and ztl lkp2 Clock Phenotypes. CAB2:LUC activity ([A] and [B]) and CCA1 expression ([C] and [D]) were analyzed in wild-type, lkp2, ztl, and ztl lkp2 plants in constant light (LL) conditions. (A) and (B) CAB2:LUC traces represent the average of the results obtained for 36 seedlings of each genotype and are representative of three independent experiments. (C) and (D) Normalized CCA1 expression level is the average (±se) of three independent biological replicates measured by real-time RT-PCR. [See online article for color version of this figure.]
Figure 2.
Figure 2.
ztl Complementation Experiment. (A) ZTL, FKF1, and LKP2 mRNA copy numbers in the wild type are the average (± SDEV) of three biological replicates and were determined for the first 24 h in LL conditions. (B) Scatterplot of the period of CAB2:LUC oscillations in LL in the wild type (n = 32), ztl (n = 32), and T1 ztl plants harboring either ZTL:ZTL (n = 35), ZTL:LKP2 (n = 42), or ZTL:FKF1 (n = 41) constructs. (C) Sum of ZTL and LKP2 mRNA copy numbers in leaves of wild-type plants (open symbols, n = 4) is compared with the levels of LKP2 in ZTL:LKP2 T1 plants (closed symbols, n = 8), which showed a similar period length to the average period of wild-type plants. The gray circles depict the distribution of wild-type data and the ZTL:LKP2 individuals that have a similar period length to wild-type plants. [See online article for color version of this figure.]
Figure 3.
Figure 3.
fkf1 Has Mild Clock Defects but Strongly Enhances ztl Phenotype. (A) to (C) CAB2:LUC activity was analyzed in wild-type, fkf1, ztl, and ztl fkf1 genotypes in LL conditions. (A) and (B) CAB2:LUC traces represent the average of the results obtained for 36 seedlings of each genotype and are representative of three independent experiments. (C) The variation in CAB2:LUC period in wild-type, fkf1, and ztl exposed to different fluences of constant white light is presented. Each data point is the average (±se) of the results obtained for a total of at least 50 seedlings analyzed during four independent experiments. (D) to (F) CCA1 (D), LHY (E), and PRR9 (F) expressions were determined in the wild-type, ztl, and ztl fkf1 genotypes. Their normalized expression levels are the average (±se) of three independent biological replicates. [See online article for color version of this figure.]
Figure 4.
Figure 4.
Comparison of ztl fkf1 and ztl fkf1 lkp2 Clock Phenotypes. CAB2:LUC activity (A) and CCA1 (D), LHY (E), and PRR9 (F) expression were analyzed in ztl fkf1 and ztl fkf1 lkp2 genotypes in LL conditions. (A) CAB2:LUC traces represent the average (±se) of the results obtained for 36 seedlings of each genotype and are representative of three independent experiments. (B) A comparison of the average period (±SDEV) of CAB2:LUC in the wild-type, ztl, ztl lkp2, ztl fkf1, and ztl fkf1 lkp2 genotypes (n = 36). (C) Results of a representative leaf movement rhythms assay experiment for wild-type (n = 16), ztl (n = 12), ztl fkf1 (n = 18), and ztl fkf1 lkp2 (n = 13) are shown. (D) to (F) Normalized CCA1 (D), LHY (E), and PRR9 (F) expression levels are the average (±se) of three independent biological replicates. [See online article for color version of this figure.]
Figure 5.
Figure 5.
FKF1 Interacts with PRR5 and TOC1 Proteins. (A) Yeast clones expressing the indicated combinations between the full-length PRR5 protein (as a prey) and the full-length ZTL, LKP2, and FKF1 proteins (as baits) were grown on appropriate media to maintain the vectors (SD-WL) and to test for the expression of the HIS3 reporter gene for the protein–protein interaction (SD-WLH). (B) and (C) Representative results of the in vitro pull-down experiments between GST alone, GST-tagged truncated versions of ZTL, FKF1, and LKP2, and the His-tagged PR domains of PRR5 (B) and TOC1 (C) are presented. Copurified PRR5-PR and TOC1-PR were detected using an anti-His antibody (top panels); 2.5% of input (top panel) and Coomassie blue staining of nitrocellulose membranes (bottom panel) display the protein amounts of His fusions, GST, and GST fusions used in these experiments. (D) and (E) HA-FKF1 was coimmunoprecipitated with either PRR5-TAP (D) or TOC1-TAP (E) using an anti-Protein A antibody. The proteins were transiently expressed either alone or in combination in the presence of proteasome inhibitor MG-132 in N. benthamiana. The GST pull-down experiment and coimmunoprecipitation experiment were performed three times with similar results.
Figure 6.
Figure 6.
Patterns of PRR5 and TOC1 Oscillations in ztl Family Mutants. PRR5 and TOC1 transcript ([A] and [B]) and protein ([C] to [F]) levels were analyzed in the wild-type, ztl, ztl lkp2, ztl fkf1, and ztl fkf1 lkp2 genotypes during the first 28 h in LL conditions. (A) and (B) Normalized PRR5 (A) and TOC1 (B) expression levels are the average between three independent biological replicates (the expression patterns of both PRR5 and TOC1 for a full 5 d in LL conditions in the wild-type, ztl, ztl fkf1, and ztl fkf1 lkp2 genotypes are shown in Supplemental Figure 2 online). (C) and (D) The results of protein immunoblotting representative of three independent experiments are shown for PRR5 (C) and TOC1 (D) proteins. The band representing TOC1 protein is indicated by an arrowhead, while an asterisk indicates a nonspecific cross-reacting band used as a loading control. (E) and (F) The relative levels of PRR5 (E) and TOC1 (F) proteins in the wild-type, ztl, ztl lkp2, ztl fkf1, and ztl fkf1 lkp2 genotypes were determined. The value of the wild-type ZT12 time point was set as 1. The data are the means obtained from three biological replicates. The means with error bars (se) of the same results are shown in Supplemental Figure 5 online. [See online article for color version of this figure.]
Figure 7.
Figure 7.
Comparison of PRR5 Degradation Rate in the Wild Type, ztl, and ztl fkf1 lkp2. (A) Confirmation of the efficiency of the interruption of protein translation by CHX treatments of the wild type at the trough of PRR5 protein (ZT0). (B) and (C) PRR5 levels were measured 0, 2, 4, 6, 8, and 10 h in LL after a CHX treatment at the peak of PRR5 protein (ZT12). Representative protein immunoblotting experiments of the decreasing amounts of PRR5 in the wild type, ztl, and ztl fkf1 lkp2 are shown in (B). The average values (±se) of relative change in the intensity of the bands to that of the bands at ZT12 were calculated from three independent biological replicates and are shown in (C). [See online article for color version of this figure.]
Figure 8.
Figure 8.
The ztl fkf1 lkp2 Phenotype Can Be Distinguished from lhy and TMG. Normalized TOC1 (A), CCA1 ([B] and [D]), LHY (C), and PRR9 ([E] and [F]) expression levels are the average (±se) between three independent biological replicates and were determined in TMG ([A] to [C] and [E]) and lhy ([D] and [F]) genotypes grown in LL conditions. The results obtained in the wild-type and ztl lines are also presented as references. [See online article for color version of this figure.]
Figure 9.
Figure 9.
PRR5 Specifically Affects LHY Transcription. (A) and (B) Plants carrying LHY:LUC (A) and CCA1:LUC (B) reporters were transformed with a 35S:PRR5 construct. Traces are the average (±se) among the indicated numbers of transgenic lines (T1). Reporter plants transformed by an empty vector are presented as a control (WT). (C) The scatterplot showing the Fourier transform nonlinear least square analysis (estimated period length versus relative amplitude error) of the LHY:LUC expression data of individual T1 seedlings used in (A). Lower values in the relative amplitude error mean robust circadian oscillation.

References

    1. Alabadi D., Oyama T., Yanovsky M.J., Harmon F.G., Más P., Kay S.A. (2001). Reciprocal regulation between TOC1 and LHY/CCA1 within the Arabidopsis circadian clock. Science 293: 880–883 - PubMed
    1. Baudry A., Kay S.A. (2008). Clock control over plant gene expression. In Advances in Botanical Research, Vol. 48, Kader J.C., Delseny M., (San Diego, CA: Elsevier; ), pp. 70–105
    1. Bell-Pedersen D., Cassone V.M., Earnest D.J., Golden S.S., Hardin P.E., Thomas T.L., Zoran M.J. (2005). Circadian rhythms from multiple oscillators: Lessons from diverse organisms. Nat. Rev. Genet. 6: 544–556 - PMC - PubMed
    1. Bläsing O.E., Gibon Y., Günther M., Höhne M., Morcuende R., Osuna D., Thimm O., Usadel B., Scheible W.R., Stitt M. (2005). Sugars and circadian regulation make major contributions to the global regulation of diurnal gene expression in Arabidopsis. Plant Cell 17: 3257–3281 - PMC - PubMed
    1. Briggs G.C., Osmont K.S., Shindo C., Sibout R., Hardtke C.S. (2006). Unequal genetic redundancies in Arabidopsis–A neglected phenomenon? Trends Plant Sci. 11: 492–498 - PubMed

Publication types

MeSH terms