Review
. 2010 May;11(5):342-52.
doi: 10.1038/nrm2883. Epub 2010 Mar 31.

Spatial organization and signal transduction at intercellular junctions

Affiliations
Review

Spatial organization and signal transduction at intercellular junctions

Boryana N Manz et al. Nat Rev Mol Cell Biol. 2010 May.

Abstract

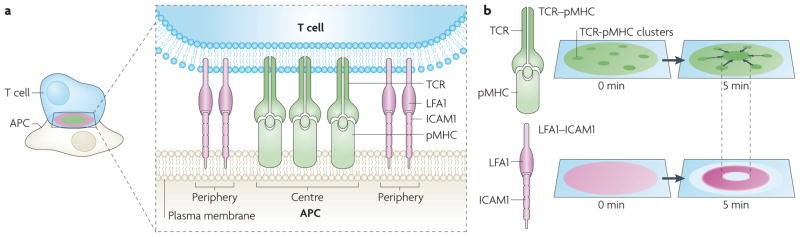
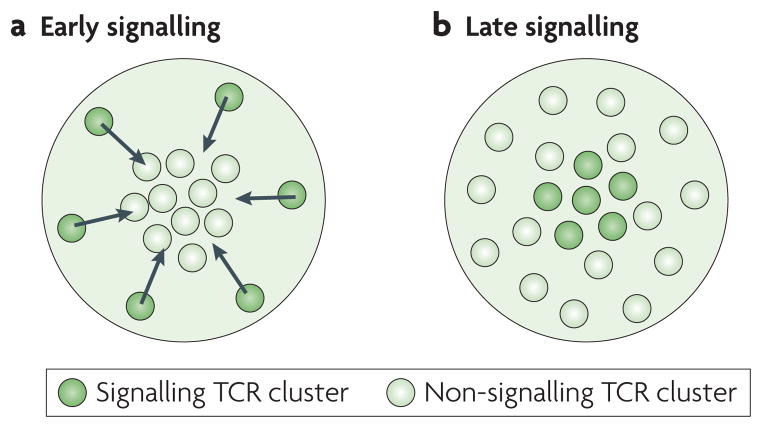
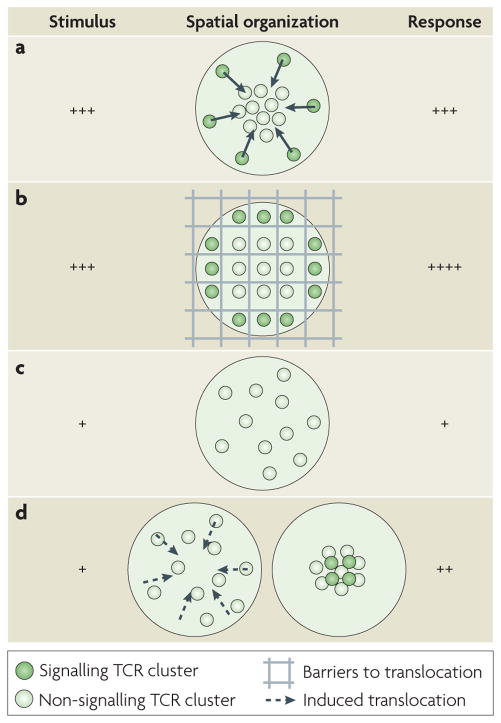
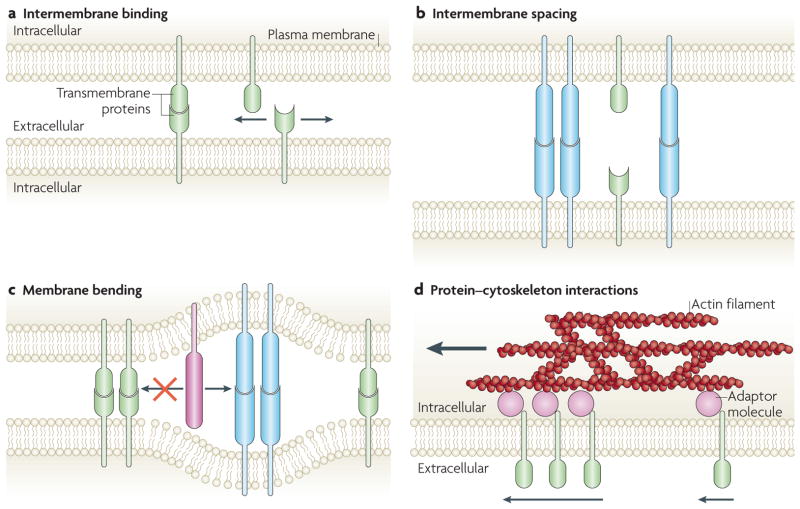
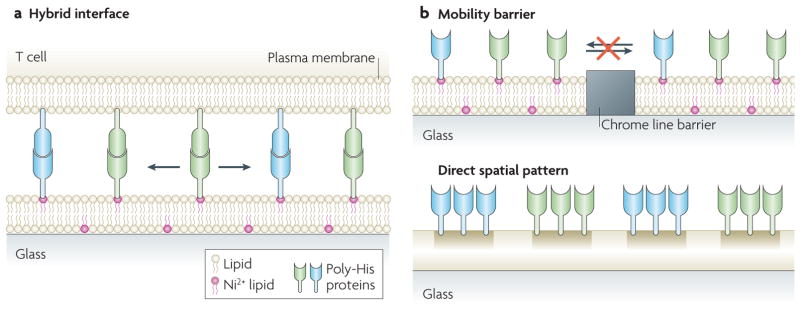
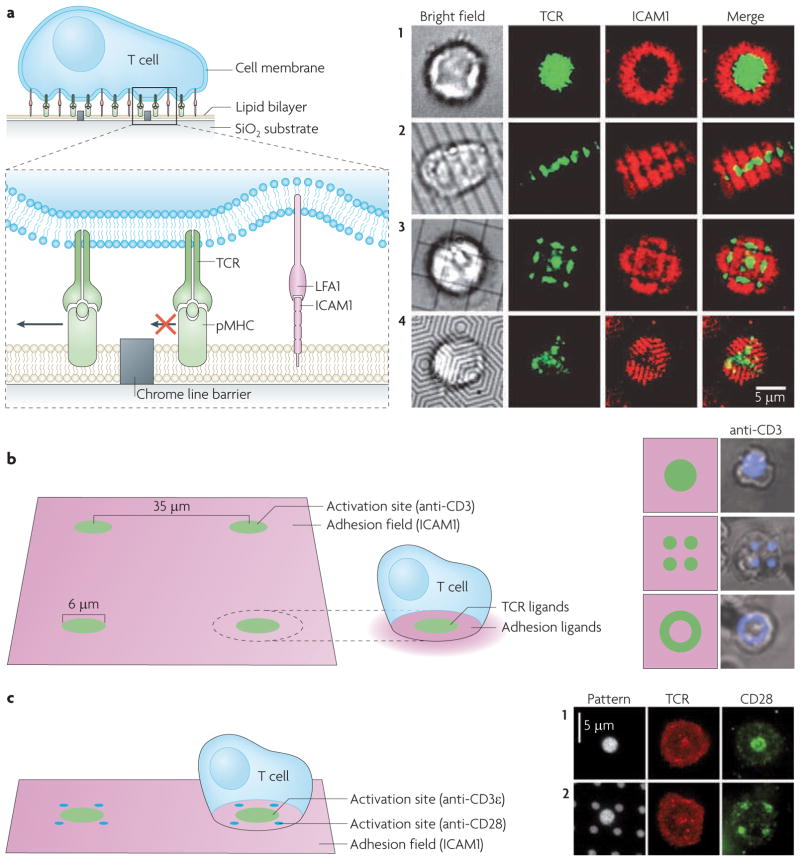
The coordinated organization of cell membrane receptors into diverse micrometre-scale spatial patterns is emerging as an important theme of intercellular signalling, as exemplified by immunological synapses. Key characteristics of these patterns are that they transcend direct protein-protein interactions, emerge transiently and modulate signal transduction. Such cooperativity over multiple length scales presents new and intriguing challenges for the study and ultimate understanding of cellular signalling. As a result, new experimental strategies have emerged to manipulate the spatial organization of molecules inside living cells. The resulting spatial mutations yield insights into the interweaving of the spatial, mechanical and chemical aspects of intercellular signalling.


Conflict of interest statement

Competing interests statement

The authors declare no competing financial interests.

Figures

Figure 1
Figure 1. Micrometre-scale protein patterns in the immunological synapse
a. The intercellular junction between a T cell and an antigen presenting cell (APC) is known as the immunological synapse. Micrometre-scale protein patterns emerge at the interface between the two cells. A top down and en face view of the immunological synapse reveals highly organized, concentric protein regions. T cell receptors (TCRs) bound to major histocompatibility complexes displaying an antigenic peptide (pMHCs) localize at the central (green) region, and the T cell leukocyte function-associated antigen (LFA1; also known as αLβ2 integrin) bound to intercellular adhesion molecule 1 (ICAM1) localizes to the peripheral (purple) region. b. Formation of micrometre-scale patterns from the time point of contact with an activating APC. TCRs recognize pMHCs and form small clusters (dark green) that are driven by the actin cytoskeleton to the centre of the immunological synapse (top). After 5 minutes, most of the TCRs are in the central zone of the immunological synapse. The T cell integrin LFA1 recognizes ICAM1 and the conjugates form an enriched ring, peripheral to the TCR central zone (bottom).
Figure 2
Figure 2. Signalling states are location-dependent in the immunological synapse
T cell receptors (TCRs) are distributed throughout the immunological synapse; however, their signalling state depends on their location and the time point from their contact with an antigen presenting cell (APC). a. At early signalling (< 20 minutes from APC contact), TCR clusters form and signal in the periphery. These clusters are transported by the actin cytoskeleton to the centre, where they are downregulated,,,. b. At late signalling (> 40 minutes from APC contact), non-signalling (or low-signalling) TCR clusters are detected in the periphery. Signalling TCR clusters that are fully phosphorylated on all sites are seen in the centre.
Figure 3
Figure 3. Spatial organization influences cell signalling in the immunological synapse
The spatial organization of signalling and non-signalling T cell receptors (TCRs) changes with different levels of cell stimulation and perturbing the spatial organization of TCRs by blocking their transport modifies the overall response of the cell. a. At high T cell activation (by strong or many agonists), signalling TCRs are located in the periphery and are transported to the centre, where they are downregulated. The T cell response is strong,,,. b. Physical barriers block the transport of TCRs to the centre at high T cell activation, and TCR clusters are constrained to the periphery, where they continue to signal. As a result, the T cell response is prolonged and higher than in part a. c. At low T cell activation (by weak or few agonists), signalling TCRs are undetectable and non-signalling TCRs are in the periphery. The T cell response is weak. d. When TCR transport to the centre is artificially induced at low levels, TCR signalling can be detected in the centre and the response of the T cell is higher than in part c.
Figure 4
Figure 4. Cellular mechanisms controlling spatial organization in intercellular junctions
The interplay of the cell membrane and cytoskeleton at intercellular junctions yields short- and long-range spatial organizations of proteins, which transcend direct protein–protein interactions. a. The probability of a binding interaction between two membrane proteins is much higher when their orientation is pre-aligned by the membrane, compared to proteins in solution. Therefore, weak interactions are effectively strengthened. b. Binding across the intercellular space is governed by intermembrane spacing, which is determined by established protein-binding pairs. c. The binding of pairs that create different sizes of intermembrane spacing are segregated (blue versus green binding pairs) to minimize membrane bending. Additionally, large proteins (red) can enter wide intermembrane spacing regions, but are excluded from entering regions of tight intermembrane spacing. d. The moving actin cytoskeleton, through multiple weak associations with adaptor molecules, can selectively transport membrane molecules (green) and establish long-range protein organization. The force applied by actin can depend on protein cluster size.
Figure 5
Figure 5. Experimental manipulation of spatial organization in intercellular junctions
a. Cell-to-cell interactions are reconstituted in hybrid interfaces between living cells and functionalized surfaces. The glass coverslip is functionalized with a supported lipid bilayer that is stably adhered to the surface, while exhibiting free diffusion (arrows) of its lipid components. Proteins are tethered to the fluid bilayer, for example by poly-histidine tags that bind Ni2+-chelating lipids. Cells recognize their membrane-anchored ligands and can rearrange their organization. b. The surface can be patterned with subcellular features that alter the native spatial organization of membrane proteins. Chrome lines are barriers to lipid mobility and the transport of membrane-tethered proteins and any cell proteins engaged with them (top). They can restrict the reorganization of cell surface proteins initiated by the cell. Different proteins (green and blue) can be immobilized to the surface in any pre-set configuration, forcing cell ligands to also reorganize according to the presented arrangement (bottom).
Figure 6
Figure 6. Immunological synapse spatial mutations
a. Physical barriers to protein transport on a fluid supported lipid bilayer. Thin chrome lines create barriers to the diffusion of bilayer-tethered proteins (such as major histocompatibility complexes displaying an antigenic peptide (pMHC)) and cellular proteins (such as T cell receptors (TCRs)) interacting with them (left). The spatial organization of the immunological synapse (TCRs (green) and intercellular adhesion molecule 1 (ICAM1; red)) without (1) and with (2–4) barriers of different geometries (right). b. Subcellular size protein patterns functionalized on a surface. A TCR-activating antibody (anti-CD3; green) and an adhesion molecule (ICAM1; purple) are patterned according to the immunological synapse pattern: anti-CD3 is central to the surrounding adhesion molecules (left). Anti-CD3, shown in schematics and cell overlays (in which anti-CD3 is blue) can be seen in a wild-type central zone pattern or in two variant patterns: multifocal and a peripheral ring (right). c. The subcellular pattern of a TCR-activating antibody (anti-CD3ε; green) and a co-stimulatory antibody (anti-CD28; blue) on an adhesion molecule (ICAM1; purple)-rich surface (left). Different patterns are tested for their effect on T cell activation: TCR and CD28 follow the pattern of anti-CD3 and anti-CD28 antibodies, respectively, which can be either co-localized or segregated. Images in part a are reproduced, with permission, from REF. © (2005) American Association for the Advancement of Science. Images in part b are reproduced, with permission, from REF. © (2006) National Academy of Sciences. Images in part c are reproduced, with permission, from REF. © (2008) National Academy of Sciences.

References

    1. Groves JT. Molecular organization and signal transduction at intermembrane junctions. Angew Chem Int Ed Engl. 2005;44:3524–3538. - PubMed
    1. Reich Z, et al. Ligand-specific oligomerization of T-cell receptor molecules. Nature. 1997;387:617–620. - PubMed
    1. Bray D, Levin MD, Morton-Firth CJ. Receptor clustering as a cellular mechanism to control sensitivity. Nature. 1998;393:85–88. - PubMed
    1. Maheshwari G, Brown G, Lauffenburger DA, Wells A, Griffith LG. Cell adhesion and motility depend on nanoscale RGD clustering. J Cell Sci. 2000;113:1677–1686. - PubMed
    1. Grakoui A, et al. The immunological synapse: a molecular machine controlling T cell activation. Science. 1999;285:221–227. - PubMed

Publication types