. 2010 Aug;18(8):924-32.
doi: 10.1038/ejhg.2010.32. Epub 2010 Mar 31.

Linkage disequilibrium and age of HLA region SNPs in relation to classic HLA gene alleles within Europe

Affiliations

Linkage disequilibrium and age of HLA region SNPs in relation to classic HLA gene alleles within Europe

Irina Evseeva et al. Eur J Hum Genet. 2010 Aug.

Abstract

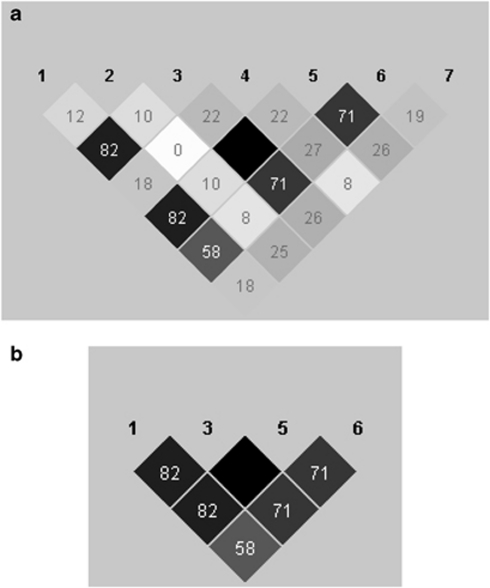
The HLA region on chromosome 6 is gene-rich and under selective pressure because of the high proportion of immunity-related genes. Linkage disequilibrium (LD) patterns and allele frequencies in this region are highly differentiated across broad geographical populations, making it a region of interest for population genetics and immunity-related disease studies. We examined LD in this important region of the genome in six European populations using 166 putatively neutral SNPs and the classical HLA-A, -B and -C gene alleles. We found that the pattern of association between classic HLA gene alleles and SNPs implied that most of the SNPs predated the origin of classic HLA gene alleles. The SNPs most strongly associated with HLA gene alleles were in some cases highly predictive of the HLA allele carrier status (misclassification rates ranged from <1 to 27%) in independent populations using five or fewer SNPs, a much smaller number than tagSNP panels previously proposed and often with similar accuracy, showing that our approach may be a viable solution to designing new HLA prediction panels. To describe the LD within this region, we developed a new haplotype clustering method/software based on r(2), which may be more appropriate for use within regions of strong LD. Haplotype blocks created using this proposed method, as well as classic HLA gene alleles and SNPs, were predictive of a northern versus southern European population membership (misclassification error rates ranged from 0 to 23%, depending on which independent population was used for prediction), indicating that this region may be a rich source of ancestry informative markers.


Figures

Figure 1
Figure 1
Schematic of the r2blocks algorithm. HAPLOVIEW plot of pairwise r2 values between a set of seven simulated SNPs; the block shading shows the strength of correlation. (a) Assuming a window size (M) of 4 and an r2 threshold of 0.70, the r2blocks algorithm begins with the highest pairwise LD value, here between SNPs 3 and 5, which are in perfect LD (r2=1.0). Starting with SNP 3, consider r2 values with SNPs 1, 2 and 4. Only SNP 1 passes the r2 threshold; add SNP 1 to the block. Discontinue growing the block to the left. Consider r2 values between SNP 5 and SNPs 4, 6 and 7 and add SNP 6. Move to SNP 6, consider r2 values between SNP 6 and 7, which is below the threshold. Terminate growing block to the right, creating block 1 of SNPs 1, 3, 5 and 6. Now consider r2 values between SNPs not assigned to blocks: SNPs 2, 4 and 7; none of the pairwise r2 values are above the threshold, hence the algorithm terminates, leaving these three SNPs as singletons. (b) The resulting haplotype block from (a).
Figure 2
Figure 2
Association of HLA-A, B and C alleles by genotyped SNPs. Plot shows −log10(P-values) of Fisher's exact tests for association between classic HLA gene alleles and genotyped SNPs passing Bonferroni correction. Association with classic HLA gene alleles only are plotted in primary colours (HLA-A = blue, HLA-B = dark yellow and HLA-C = red); association with two classic HLA gene alleles are shown as secondary colours (HLA-A (blue) and HLA-B (yellow) = green; HLA-A (blue) and HLA-C (red) = violet; HLA-B (yellow); and HLA-C (red) = orange); association with all three classic HLA gene alleles = black. The position of HLA-DRA1 is between SNPs 122 and 123 and that of HLA-DRB1, HLA-DQA1 and HLA-DQB1 are between SNPs 129 and 130.
Figure 3
Figure 3
Histograms of the number of minor allele carriers at associated SNPs by HLA allele carrier status. (a) HLA-A*01 (18 SNPs), (b) HLA-A*03 (12 SNPs), (c) HLA-B*08 (27 SNPs); y-axis = frequency, x-axis = number of SNPs in which individuals carry at least one minor allele. Blue = HLA allele noncarrier; red = HLA allele carrier.
Figure 4
Figure 4
HLA region haplotype blocks in European populations defined by r2blocks and the Gabriel, four-gamete rule and solid spine of LD methods. Plots show the LD heatmap of pairwise r2 values for SNPs. Top bar represents physical spacing of SNPs. Triangles show the location of haplotype blocks defined by each method. Methods are indicated on the left hand side of each plot. (a) Pooled European populations; red triangles show blocks added by reducing the r2 threshold from 0.7 to 0.5 using r2blocks. (b) Blocks obtained using r2blocks with an r2 threshold of 0.70 in northern European populations (top) and southern European populations (bottom); (c) blocks obtained using r2blocks with an r2 threshold of 0.50 in northern European populations (top) and southern European populations (bottom). (d) Blocks obtained using the Gabriel method in northern European populations (top) and southern European populations (bottom).

References

    1. Miretti MM, Walsh EC, Ke X, et al. A high-resolution linkage-disequilibrium map of the human major histocompatibility complex and first generation of tag single-nucleotide polymorphisms. Am J Hum Genet. 2005;76:634–646. - PMC - PubMed
    1. Shen R, Fan JB, Campbell D, et al. High-throughput SNP genotyping on universal bead arrays. Mutat Res. 2005;573:70–82. - PubMed
    1. Tonks S, Marsh S, Bunce M, Bodmer JG. Molecular typing for HLA class I using ARMS-PCR: further development following the 12th International Histocompatibility Workshop. Tissue Antigens. 1999;53:175–183. - PubMed
    1. Bartlett S, Straub J, Tonks S, Wells RS, Bodmer JG, Bodmer WF. Alkaline-mediated differential interaction (AMDI): a simple automatable single-nucleotide polymorphism assay. Proc Natl Acad Sci USA. 2001;98:2694–2697. - PMC - PubMed
    1. Barrett JC, Fry B, Maller J, Daly MJ. Haploview: analysis and visualization of LD and haplotype maps. Bioinformatics. 2005;21:263–265. - PubMed

Publication types