Comparative Study
. 2009 Sep;92(2):257-74.
doi: 10.1901/jeab.2009.92-257.

Effects of differing response-force requirements on food-maintained responding in C57Bl/6J mice

Affiliations
Comparative Study

Effects of differing response-force requirements on food-maintained responding in C57Bl/6J mice

Troy J Zarcone et al. J Exp Anal Behav. 2009 Sep.

Erratum in

  • J Exp Anal Behav. 2010 Jan;93(1):141-2

Abstract

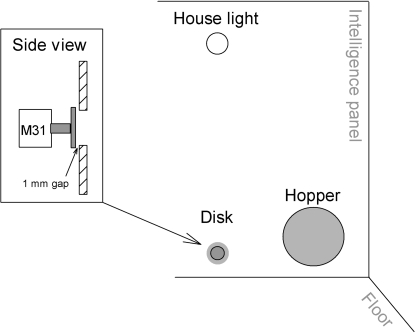
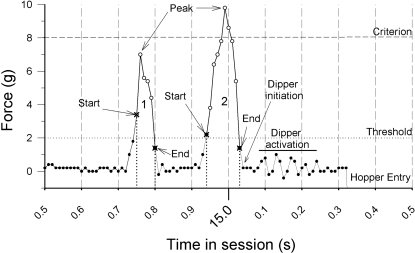
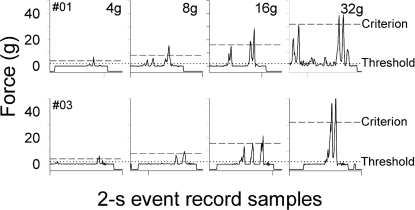
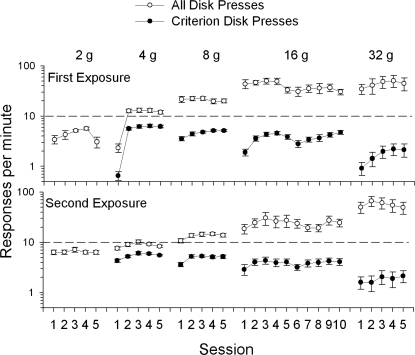
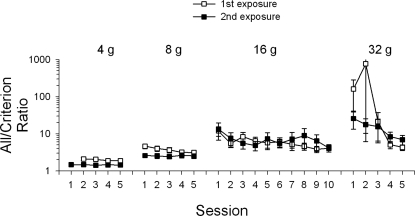
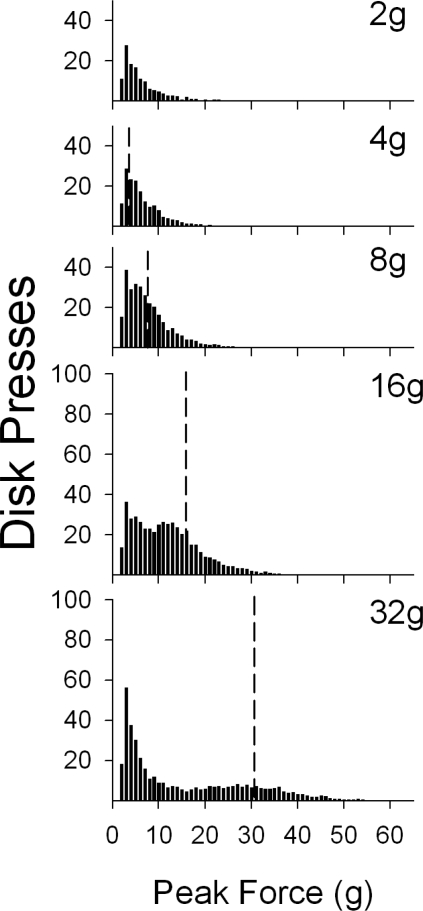
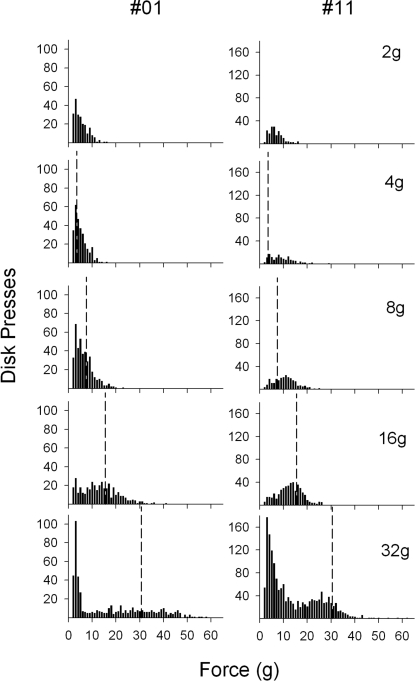
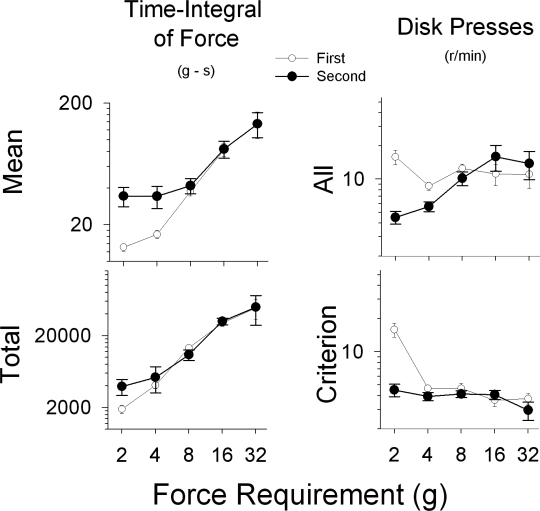
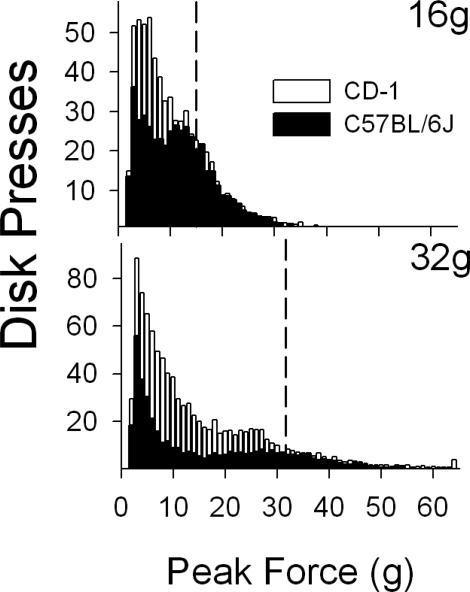
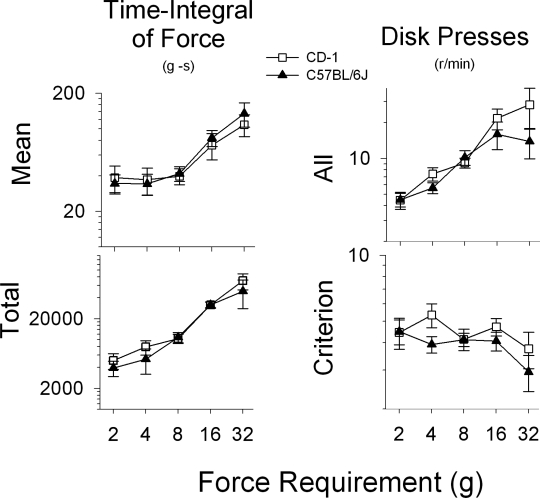
The effect of force requirements on response effort was examined using inbred C57BL/6J mice trained to press a disk with their snout. Lateral peak forces greater than 2 g were defined as responses (i.e., all responses above the measurement threshold). Different, higher force requirements were used to define criterion responses (a subclass of all responses) that exceeded the requirement and produced a reinforcer. The reinforcer was sweetened, condensed milk, delivered upon response termination. All mice were exposed to two ascending series of criterion force requirements (2, 4, 8, 16, and 32 g). Increasing the force requirement initially decreased criterion response rates, but criterion response rates recovered with continued exposure, except at the 32-g requirement. Response rates for all measured responses initially increased with increasing force requirements, but then decreased with continued exposure. The second exposure series produced more stable response rate changes than the first series. The time-integral of force (area under the force-time curve for individual responses, which is proportional to energy expenditure for each response) increased with the increase in the force requirement. The C57BL/6J inbred strain generated average force output similar to CD-1 outbred stock mice trained on the same force requirements. C57BL/6J inbred strain mice differed from CD-1 mice in initial response rates (for all responses above threshold) and had lower response rates at the 16 and 32 g requirements resulting in lower total force output. These data show for both mice types that increased force requirements resulted in increased overall responding (all measured responses), which contradicts a punishment interpretation of criterion response decrements. C57BL\6 inbred mice showed individual differences comparable to the outbred CD-1 stock. C57BL/6 mice did not maintain responding as well at the higher force requirements, which may be due to their small body size and weight, compared to the larger and heavier CD-1 mice.

Keywords: C57BL/6J mice; disk press; effort; force; operant.


Figures

Fig 1
Fig 1
Diagram of intelligence panel and force disk placement in the operant chambers. The bottom of the force disk hole was located 1 cm above the chamber floor. Both the houselight and force disk hole were centered on the intelligence panel 9.25 cm from either side wall.
Fig 2
Fig 2
Waveform of disk presses sampled at 100 Hz. The figure shows one subcriterion response followed by a criterion response and the beginning of a hopper entry. The y-axis shows disk-press force in g, and the x-axis shows time in 0.01-s units. Filled circles show force samples that occurred below the “measurement” threshold. Empty circles show samples that exceeded the measurement threshold. The dotted horizontal line and the dashed horizontal line show the threshold and criterion values. The vertical dotted lines emphasize the time that a response started and ended. Towards the end of the sample the wave form line falls below zero, which indicates a hopper entry.
Fig 3
Fig 3
Individual response samples for two C57BL/6J mice during the last session of the 4-, 8-, 16-, and 32-g requirements of the second exposure. Each panel shows a 2-s event record sample from a separate session, one event record for each of the different force requirements. Samples were taken from the first 2 min of each session and are typically the third or fourth reinforced response of a session. The y-axis is expressed in gram-equivalent weights, and the length of the x-axis is 2 s. All panels have the same x- and y-axis ranges. Dashed horizontal lines designate the force requirement; dotted horizontal lines designate the threshold. A zero reading shows that no force was being applied to the disk. A reading below zero (i.e., −20) designates a hopper entry. A reading above zero indicates an increase in the force applied to a disk.
Fig 4
Fig 4
Response rates for all responses (open circles) and criterion responses (closed circles) as a function of session during the first exposure (top panel) and second exposure (bottom panel) to the different force-requirement phases (2, 4, 8, 16, and 32 g). The y-axis is logarithmic, and the error bars indicate the standard error of the mean (SEM). For the 2-g requirement, all responses are criterion responses.
Fig 5
Fig 5
Ratio of all responses to criterion responses as a function of session. Open squares show data from the first exposure and filled squares show data from the second exposure for force requirement phases 4, 8, 16, and 32 g. The y-axis is logarithmic.
Fig 6
Fig 6
Group frequency distributions of disk presses for the last session of each force requirement during the second exposure. The vertical dashed lines designate the force requirement; all data to the right of the vertical dashed line represent criterion responses. The y-axes for the 2-, 4-, and 8-g panels have been cropped for clarity, but are the same scale as the panels for the 16-g and 32-g phases.
Fig 7
Fig 7
Frequency distribution samples of disk-press forces for individual C57BL/6J mice (#01, first column, and #11, second column) during the last session of each force requirement (2, 4, 8, 16, and 32 g) of the second exposure. The vertical dashed lines designate the force requirement; all data to the right of the line represent criterion responses. The y-axes are different for each mouse, but the same across phases.
Fig 8
Fig 8
Mean and total time-integral of force (left panels) and all and criterion response rates (right panels) as a function of the first (open circles) and second (filled circles) exposures to the different force requirements (2, 4, 8, 16, and 32 g). Data points were calculated from the last session of each phase.
Fig 9
Fig 9
Frequency distributions of disk press forces for CD-1 mice (white bars Zarcone, et al., 2007) and C57BL/6J mice (black bars) from the 16-g requirement (top panel) and 32-g requirement (bottom panel). The vertical dashed lines designate the force requirement; all data to the right of the line represent criterion responses. The y-axes are different for each panel.
Fig 10
Fig 10
Mean and total time-integral of force (left panels) and all and criterion disk press rates (right panels) for CD-1 (open circles Zarcone, et al., 2007) and C57BL/6J (filled circles) mice during the second exposure to the force requirements (2, 4, 8, 16, and 32 g). Data points were calculated from the last session of each phase.

References

    1. Alling K, Poling A. The effects of differing response-force requirements on fixed-ratio responding of rats. Journal of the Experimental Analysis of Behavior. 1995;63:331–346. - PMC - PubMed
    1. Baron S.P, Meltzer L.T. Mouse strains differ under a simple schedule of operant learning. Behavioural Brain Research. 2001;118:143–152. - PubMed
    1. Blough D.S. The study of animal sensory processes by operant methods. In: Honig W.K, editor. Operant behavior: Areas of research and application. New York: Appleton-Century-Crofts; 1966. pp. 245–379. In.
    1. Cabib S, Puglisi-Allegra S, Ventura R. The contribution of comparative studies in inbred strains of mice to the understanding of the hyperactive phenotype. Behavioural Brain Research. 2002;130:103–109. - PubMed
    1. Catania A.C. The concept of the operant in the analysis of behavior. Behaviorism. 1973;1:103–116.

Publication types