. 2010 Jun;163(2):335-40.
doi: 10.1007/s00442-010-1605-5. Epub 2010 Mar 31.

Cues of intraguild predators affect the distribution of intraguild prey

Affiliations

Cues of intraguild predators affect the distribution of intraguild prey

Yasuyuki Choh et al. Oecologia. 2010 Jun.

Abstract

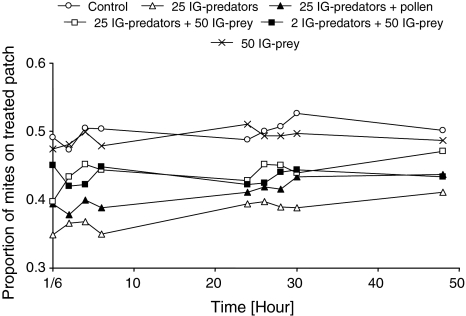
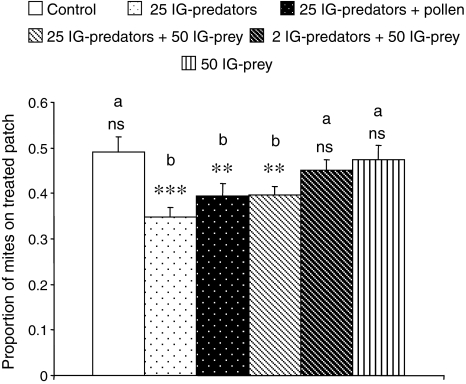
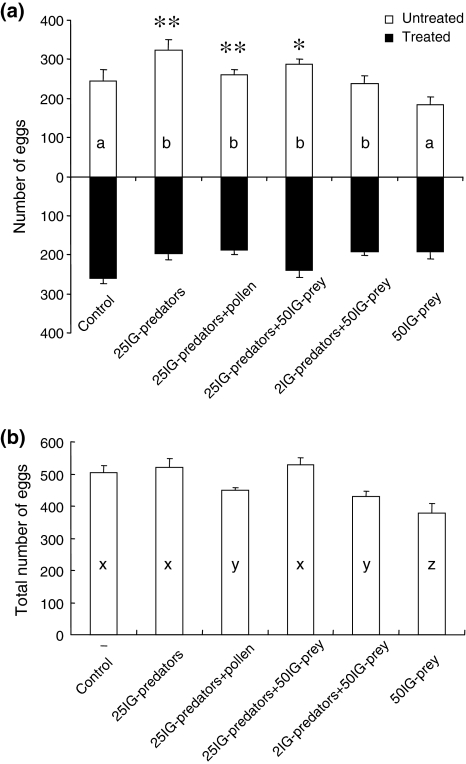
Theory on intraguild (IG) predation predicts that coexistence of IG-predators and IG-prey is only possible for a limited set of parameter values, suggesting that IG-predation would not be common in nature. This is in conflict with the observation that IG-predation occurs in many natural systems. One possible explanation for this difference might be antipredator behaviour of the IG-prey, resulting in decreased strength of IG-predation. We studied the distribution of an IG-prey, the predatory mite Neoseiulus cucumeris (Acari: Phytoseiidae), in response to cues of its IG-predator, the predatory mite Iphiseius degenerans. Shortly after release, the majority of IG-prey was found on the patch without cues of IG-predators, suggesting that they can rapidly assess predation risk. IG-prey also avoided patches where conspecific juveniles had been killed by IG-predators. Because it is well known that antipredator behaviour in prey is affected by the diet of the predator, we also tested whether IG-prey change their distribution in response to the food of the IG-predators (pollen or conspecific juveniles), but found no evidence for this. The IG-prey laid fewer eggs on patches with cues of IG-predators than on patches without cues. Hence, IG-prey changed their distribution and oviposition in response to cues of IG-predators. This might weaken the strength of IG-predation, possibly providing more opportunities for IG-prey and IG-predators to co-exist.


Figures

Fig. 1
Fig. 1
The fraction of IG-prey on the treated patches from 10 min (1/6 h) to 48 h after their introduction. The distribution of IG-prey was measured on two interconnected clean patches (control), or a clean patch interconnected with a patch with cues left by IG-predators. IG-predators were either released on one of the two patches without food (25 IG-predators), with pollen as food (25 IG-predators + pollen), or with juvenile IG-prey as food (25 IG-predators + 50 IG-prey and 2 IG-predators + 50 IG-prey). As a final control, a patch was treated by releasing 50 juvenile IG-prey without IG-predator (50 IG-prey). A random distribution of the IG-prey over the two patches corresponds to a proportion of 0.5 of all mites on the treated patch. For reasons of clarity, standard errors are not given
Fig. 2
Fig. 2
The initial proportion (+SEM) of IG-prey on the treated patch. See legend to Fig. 1 for further explanation. For each treatment, the observed distributions were tested against a random distribution (proportion of 0.5) with a t test: ns not significant; P > 0.05; **P < 0.005; ***P < 0.0001. Different letters above each bar indicate significant differences among the treatments (GLM, P < 0.0001)
Fig. 3
Fig. 3
The distribution and total number of eggs laid by IG-prey during 48 h. The eggs of IG-prey were counted on two connected clean patches (control), or a clean patch connected to a patch treated with IG-predators. See legend to Fig. 2 for further explanation. a The distribution of the eggs over the two patches per treatment. Shown are the average number (+SEM) of eggs on the treated (black bars extending downwards) and untreated patch (white bars extending upwards). Asterisks indicate significant differences in the oviposition between the clean patch and the treated patch within each treatment: *P < 0.05, **P < 0.01. Differences in distribution of eggs among treatments are indicated with different letters inside the bars. b The average (+SEM) total number of eggs on both patches per treatment. Differences in total numbers of eggs among treatments are indicated with different letters inside the bars

References

    1. Agarwala BK, Yasuda H, Kajita Y. Effect of conspecific and heterospecific feces on foraging and oviposition of two predatory ladybirds: role of fecal cues in predator avoidance. J Chem Ecol. 2003;29:357–376. doi: 10.1023/A:1022681928142. - DOI - PubMed
    1. Crawley MJ (2007) The R book. Wiley, New York
    1. De Moraes GJ, McMurtry JA, Denmark HA, Campos CB. A revised catalog of the mite family Phytoseiidae. 1. Auckland: Magnolia; 2004.
    1. Faraji F, Janssen A, van Rijn PCJ, Sabelis MW. Kin recognition by the predatory mite Iphiseius degenerans: discrimination among own, conspecific, and heterospecific eggs. Ecol Entomol. 2000;25:147–155. doi: 10.1046/j.1365-2311.2000.00240.x. - DOI
    1. Fretwell SD. Populations in a seasonal environment. Princeton: Princeton University Press; 1972. - PubMed

Publication types

LinkOut - more resources