. 2010 May 11;49(18):3824-41.
doi: 10.1021/bi100055m.

Structure of the ternary complex formed by a chemotaxis receptor signaling domain, the CheA histidine kinase, and the coupling protein CheW as determined by pulsed dipolar ESR spectroscopy

Affiliations

Structure of the ternary complex formed by a chemotaxis receptor signaling domain, the CheA histidine kinase, and the coupling protein CheW as determined by pulsed dipolar ESR spectroscopy

Jaya Bhatnagar et al. Biochemistry. .

Abstract

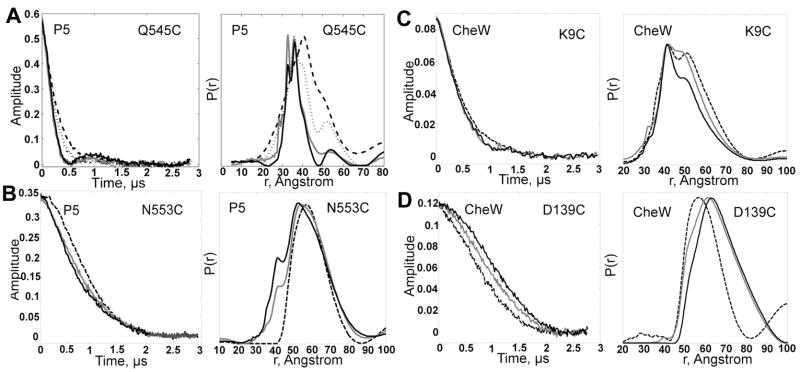
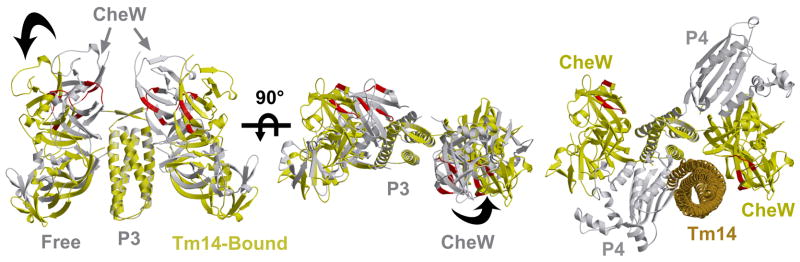
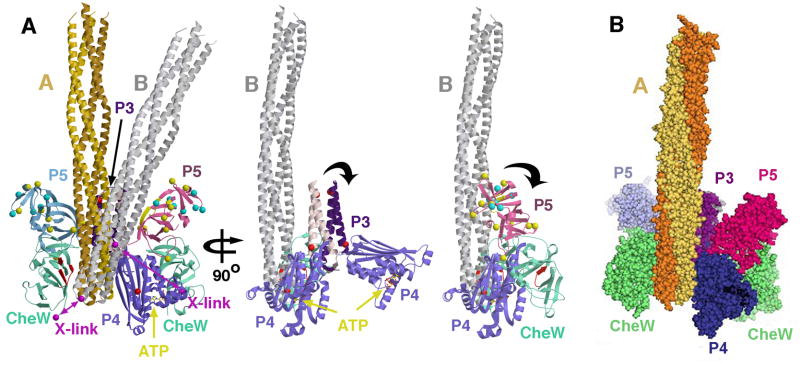
The signaling apparatus that controls bacterial chemotaxis is composed of a core complex containing chemoreceptors, the histidine autokinase CheA, and the coupling protein CheW. Site-specific spin labeling and pulsed dipolar ESR spectroscopy (PDS) have been applied to investigate the structure of a soluble ternary complex formed by Thermotoga maritima CheA (TmCheA), CheW, and receptor signaling domains. Thirty-five symmetric spin-label sites (SLSs) were engineered into the five domains of the CheA dimer and CheW to provide distance restraints within the CheA:CheW complex in the absence and presence of a soluble receptor that inhibits kinase activity (Tm14). Additional PDS restraints among spin-labeled CheA, CheW, and an engineered single-chain receptor labeled at six different sites allow docking of the receptor structure relative to the CheA:CheW complex. Disulfide cross-linking between selectively incorporated Cys residues finds two pairs of positions that provide further constraints within the ternary complex: one involving Tm14 and CheW and another involving Tm14 and CheA. The derived structure of the ternary complex indicates a primary site of interaction between CheW and Tm14 that agrees well with previous biochemical and genetic data for transmembrane chemoreceptors. The PDS distance distributions are most consistent with only one CheW directly engaging one dimeric Tm14. The CheA dimerization domain (P3) aligns roughly antiparallel to the receptor-conserved signaling tip but does not interact strongly with it. The angle of the receptor axis with respect to P3 and the CheW-binding P5 domains is bound by two limits differing by approximately 20 degrees . In one limit, Tm14 aligns roughly along P3 and may interact to some extent with the hinge region near the P3 hairpin loop. In the other limit, Tm14 tilts to interact with the P5 domain of the opposite subunit in an interface that mimics that observed with the P5 homologue CheW. The time domain ESR data can be simulated from the model only if orientational variability is introduced for the P5 and, especially, P3 domains. The Tm14 tip also binds beside one of the CheA kinase domains (P4); however, in both bound and unbound states, P4 samples a broad range of distributions that are only minimally affected by Tm14 binding. The CheA P1 domains that contain the substrate histidine are also broadly distributed in space under all conditions. In the context of the hexagonal lattice formed by trimeric transmembrane chemoreceptors, the PDS structure is best accommodated with the P3 domain in the center of a honeycomb edge.


Figures

FIGURE 1
FIGURE 1. Spin label positions on CheA, CheW and Tm14
Ribbon representation of CheA (P1 – red, P2 – green, P3 – dark purple and grey, P4 – light pink and blue, P5 – magenta and light blue) and CheW (cyan) and Tm14 (yellow and orange) showing positions of residues mutated to Cys (yellow balls) and labeled with MTSSL for dipolar ESR or applied in disulfide cross-linking experiments. P1 and P2 are connected to P3, P4 and P5 by long unstructured linkers (dotted lines). For clarity, only one P1 and P2 domain is shown and spin-label sites are marked on only one CheA, CheW, and Tm14 subunit. CheW and P5 have related folds composed of two pseudosymmetric β-barrels known as subdomain 1 (SD1) and subdomain 2 (SD2).
FIGURE 2
FIGURE 2. Possible spin-spin interactions in a ternary complex of Tm14:CheAΔ289:CheW
Schematic diagram for spin label separations containing a CheAΔ289 dimer, bound to two CheW proteins and single chain receptor. In CheAΔ289, P4 domains are not shown for clarity. Intermolecular and intramolecular distances are represented by solid and dashed double headed arrow respectively.
FIGURE 3
FIGURE 3. Dipolar ESR data for symmetric SLSs on P1, P2 and P4
Time domain signal (left) and corresponding distance distributions (right) for P1 sites (A) A76 (B) A178 and (C) P4 A496. For P1 and P2, signals are compared in the absence (dotted line) and presence of unlabeled receptor (solid line), and for P4 in the absence (dotted line) and presence (solid line) of ATP. All time domain signals and distance distributions are scaled to a common value for ease in comparison. In (A) the concentrations of CheA, CheW and Tm14 were 25 μM, 125 μM and 225 μM, respectively. In (B), CheA, CheW and unlabeled Tm14C concentrations were 25 μM, 125 μM and 300 μM, respectively. In (C), concentrations of spin labeled CheAΔ289, CheW and ATP were 50 μM, 100 μM and 500 μM, respectively. MgCl2 was added at (500 μM).
FIGURE 4
FIGURE 4. Dipolar ESR data for symmetric SLSs on P5 and CheW
Time domain signal (left) and corresponding distance distributions (right) for P5 sites (A) A545, (B) A553, (C) CheW W9, and (D) CheW W139. Signals are compared in the absence (dashed line) and presence of unlabeled receptor (solid line). In the case of A545, an additional data set is shown for Tm14 binding in the absence of CheW (dotted line). Darker shades of solid lines indicate increasing receptor concentrations (see below). All time domain signals and distance distributions are scaled to a common value for ease of comparison. CheA concentrations and CheW concentrations were constant at 25 μM, and 125 μM. (A) Tm14 is shown at 75 and 225 μM. (B) Tm14 shown 75 and 225 μM. (C) Tm14 shown at 150 and 300 μM (D) Tm14 shown at 100 and 200 uM.
FIGURE 5
FIGURE 5. Conformational changes in CheA:CheW on binding Tm14
Comparison of initial structure of CheAΔ289/CheW (grey) to the final structure (yellow) in the presence of Tm14 after rigid body refinement against PDS distance restraints of Table 1. P4 domains are omitted from the left and center structures for clarity. Regions of CheW important for binding MCPs are in red. Right - A dimeric MCP (brown) is docked in the pocket created by the rotation of CheW.
FIGURE 6
FIGURE 6. Dipolar signals and distance distributions between SL-CheA:CheW and SL-receptor
Time domain signal (left) and corresponding distance distributions (right) for Tm14C:CheA:CheW complexes. PDS data are compared for SL-CheA:CheW in the presence of unlabeled receptor (dotted lines) to the presence of spin-labeled receptor (solid lines). (A) P3 A318 to R100 and R111: Tm14C concentrations were 300 μM and CheAΔ289/CheW were at 25 μM and 125 μM, respectively. (B) P5 A634 to R100 and R111. Tm14C concentrations were 300 μM and CheAΔ289/CheW were at 25 μM and 125 μM respectively. (C) CheW 9 to R149: CheAΔ289: spin labeled CheW were at 50 μM and 100 μM respectively, whereas R149 was at 300 μM. (D) CheW 80 to R167: CheAΔ289: spin labeled CheW was at 50 μM and 100 μM, respectively whereas R167 was at 400 μM.
FIGURE 7
FIGURE 7. Disulfide cross-linking confirms points of interaction in the ternary complex
(A) SDS-Page gel showing crosslinking between site CheW K9C and N149C on single chain Tm14C receptor. (B) Crosslinking between Tm14C homodimer N125C and CheΔ289K496C. All protein concentrations were 2μM and Cu(II)(phenanthroline)3 was used as the crosslinking initiator.
FIGURE 8
FIGURE 8. PDS structure of the CheA:CheW:Tm14 ternary complex
PDS data bounds Tm14 within two orientations (A; yellow) and (B; grey). Tm14 resides between CheW and P4 of an adjacent subunit. The P3 domain aligns roughly antiparallel to the the tip of Tm14, which sits close to the N-terminus of CheW. Secondary structure elements on CheW important for binding with MCPs (88, 91) are colored in red, with the analogous regions on P5 in yellow. Positions on P3 and P4 predicted to interact from protection studies on S. typhimurium CheA (27) are shown as red spheres. Residues on P5 have been implicated in receptor-mediated activation of E. coli CheA (yellow spheres), and also ligand-mediated deactivation (cyan spheres). Magenta balls and lines designate positions that undergo disulfide cross linking. In middle view, P5 and CheW domains are removed for clarity, in right view, P5 and CheW are shown without P3. Black arrows denote directions of domain motions indicated from simulation of the ESR time-domain data. (B) Space filling representation of (A), left panel, with Tm14 orientation A shown.
FIGURE 9
FIGURE 9. Incorporation of the PDS ternary complex into an MCP membrane array
(A) Spacing of the transmembrane MCP trimers observed by cryo-EM (70–78 Å) taken with the PDS structure suggest that the P3 domain could bridge adjacent receptor trimers. If PDS orientation A is superimposed on a single dimer within the trimer, the receptor from orientation B overlaps with the position and an adjacent dimer within the trimer. CheW and P5 domains associated with the same CheA subunit are also spaced appropriately to bridge adjacent trimers with similar interaction surfaces (red and yellow). In left view, no P4 domains are shown, in right view, only one. Receptor trimers were generated from the coordinates of the Tsr cytoplasmic domain (39), adjusted to fit EM reconstruction envelopes (57). (B) Schematic diagram for how edge positioning of the CheA P3 domain could be elaborated into a hexagonal lattice of chemoreceptors. Domain sizes and edge spacings are roughly to scale and thus, only alternating edges could accommodate a P3 domain and still allow the associated P5 and CheW domains to fit within a hexagon.

References

    1. Wadhams GH, Armitage JP. Making sense of it all: bacterial chemotaxis. Nat Rev Mol Cell Biol. 2004;5:1024–1037. - PubMed
    1. Parkinson JS, Kofoid EC. Communication modules in bacterial signaling proteins. Annu Rev Genet. 1992;26:71–112. - PubMed
    1. Hazelbauer GL, Falke JJ, Parkinson JS. Bacterial chemoreceptors: high-performance signaling in networked arrays. Trends In Biochemical Sciences. 2008;33:9–19. - PMC - PubMed
    1. Sourjik V. Receptor clustering and signal processing in E. coli chemotaxis. Trends Microbiol. 2004;12:569–576. - PubMed
    1. Falke JJ, Hazelbauer GL. Transmembrane signaling in bacterial chemoreceptors. Trends Biochem Sci. 2001;26:257–265. - PMC - PubMed

Publication types

MeSH terms