

Review
doi: 10.1021/cr900343z.
Fluorescence lifetime measurements and biological imaging
Affiliations
- PMID: 20356094
- PMCID: PMC2924670
- DOI: 10.1021/cr900343z
Item in Clipboard
Review
Fluorescence lifetime measurements and biological imaging
Chem Rev.
.
No abstract available
Figures

Jablonski diagram and a timescale of photophysical processes for organic molecules.

Number of citations per year for the period between 1948-2008 where the fluorescence lifetime concept is utilized (from Scifinder® database).

Becquerel's phosphoroscope invented in 1859. This apparatus was made by the instrument maker L.J. Duboscq and had a resolution of 8 ×10⁻⁴ sec.
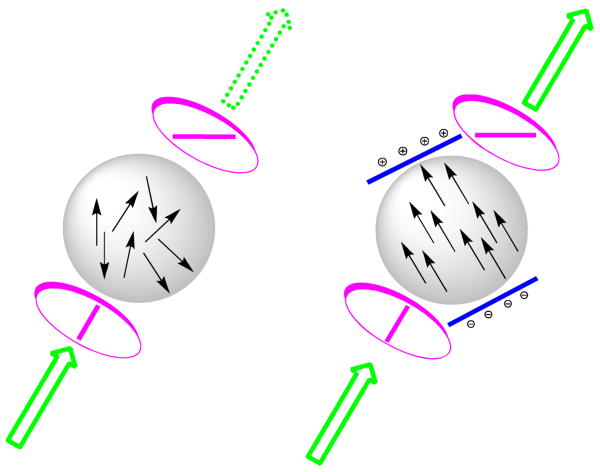
Principle of a Kerr cell. The cell is placed between two polarization plates oriented at 90° to each other (pink). If no electric field was applied through immersed electrodes (blue), no light could pass through the crossed polarizers. Orientation of molecules is shown in black arrows. By applying an electric field, molecules realigned with the field, allowing the light to pass through. After removing the electric field, the effect disappeared and depolarization restored.

Original drawing of Abraham and Lemoine's instrument - the first device for measuring nanosecond time intervals. An electric spark E and a Kerr cell K were synchronously activated. Light from the spark travelled to an analyzer V through the set of mirrors M1-M2-M3-M4, a polarizer N1, and a Kerr cell filled with CS2. An analyzer consisted of a birefringence filter and another polarizer N2 perpendicular to N1. By rotating the analyzer, a phase shift between two ordinary and extraordinary beams was measured as a function of a distance set by the positions of mirrors M1 and M2. If the light traveled too long, the birefringence disappeared. By moving the mirrors, the phase shift between the two beams vs. distance was evaluated. At a distance of several meters from the spark, the phase shift was negligible and at a distance of 80 cm, birefringence was reduced by half, leading to the estimation of depolarization half-time as 2.7 ns.

Structures of first synthetic dyes.

Time domain data obtained from ICG and Pyrrolopyrrole cyanine -BF2 (PPC) in DMSO (cuvette) using excitation with Nanoled® at 773 nm and emission at 820 nm. Prompt corresponds to the instrument response with no fluorophore present. Note the log scale of y-axis. Adapted from Ref. 52 Copyright 2009 Elsevier.

Frequency domain data obtained from conversion of time domain data shown in Figure 7 via Fourier transform. Left: Phase and modulation at 80 MHz frequency, excitation (black), emission (red – ICG, blue- PPC-BF2) illustrating the phase-angle shift (φ) and demodulation ratio (M). Right: fluorescence lifetime data simulated at different frequencies different frequencies (courtesy of R. Nothdurft and J. Culver, Washington University, St. Louis).

Parallel F‖(t) and perpendicular F⊥(t) polarized decays of Coumarin 6 in ethylene glycol. The calculated anisotropy decay curve is shown at right. An appropriate portion of r(t) was fitted to a single-exponential decay model providing θr = 2.1 ± 0.1 ns. Adapted from Ref. 541 Copyright 2003 Springer Science+Business Media.

Basic radiative transitions occurring between the ground and excited state according to Einstein.

Rigid structures of fluorescent probes with long fluorescence lifetime

Double log plot of fluorescence lifetime of cypate vs. viscosity in glycerol-ethylene glycol mixture at 20 °C. Reprinted from Ref. 102 Copyright 2008 SPIE.
Examples of fluorescent compounds increasing lifetime in higher viscosity media.

Structures and fluorescence lifetime of cyanine probes vs. solvent orientation polarizability. 1 – water, 2 – methanol, 3 – ethanol, 4 – acetone, 5 – DMSO, 6 – methylene chloride, 7 – chloroform. Adapted from Ref. 51 Copyright 2007 Elsevier.
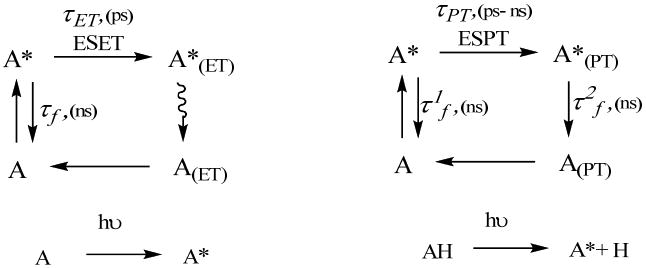
Schematics and timescale of the excited state electron transfer.

Typical ESET molecules with electron donating tertiary amines and electron withdrawing nitrogroups.,,

Deprotonated fluorescent imidazole in the excited state is more acidic than in the ground state and has a shorter fluorescent lifetime than the protonated imidazolium.

Diagram of FRET. Upon excitation by the photon, the electron of the donor is promoted to the excited state (1) followed by the energy transfer to the acceptor excited orbital (2), simultaneous return of the excited electron back to the ground state (3), and excitation of an acceptor (3).

A. Dependence of the fluorescence lifetime of a typical DA pair as a function of the distance in Förster energy transfer mechanism and Dexter electron transfer. B. Dipole vectors and their angles for the donor (D) in the excited state and the acceptor (A) in the ground state (from 146). C. Fluorescence lifetime changes as a function of orientation factor (k2), derived from Eq. 22.

Dexter electron transfer: In the initial state, the donor and acceptor orbitals are overlapping. Upon excitation by the photon, the electron of the donor is promoted to the excited state (1), followed by the electron transfer to the acceptor excited orbital (2), and back electron transfer from the acceptor in the excited state to donor (3).

ET constructs with alkynyl bonds,,

Structures of Rhodamine 6G and DBPI used in reabsorption studies. For DBPI the probability of self-re-absorption for concentrations 1 uM to 1 mM is 0 - 0.56, φ = 0.98 resulting in the lifetime range from 3.7 to 8.52 ns. Chart: Fluorescence lifetime of Rhodamine 6G in methanol (molecular fluorescence lifetime is ∼ 4 ns) as a function of the concentration of the dye: (◊) measured lifetime, (■) measured lifetime corrected for self-absorption. Reprinted from Ref. 187 Copyright 1977 American Chemical Society.

Pyrene probes after hybridizing with target (blue) form an excimer with long fluorescence lifetime.

Structures of fluorescent amino acids and fluorescence average lifetime image of SiHa cells. Ex. 600 nm, em. 340-360 nm. Reprinted from Ref. 217 Copyright 2009 Optical Society of America.

Structures of NAD, NADH, NADPH, FAD, and FADH2.

Jablonski diagram of photosynthetic process leading to fluorescence.
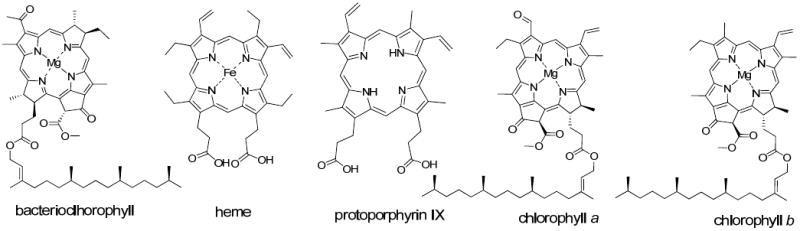
Porphyrins identified in biological tissues.
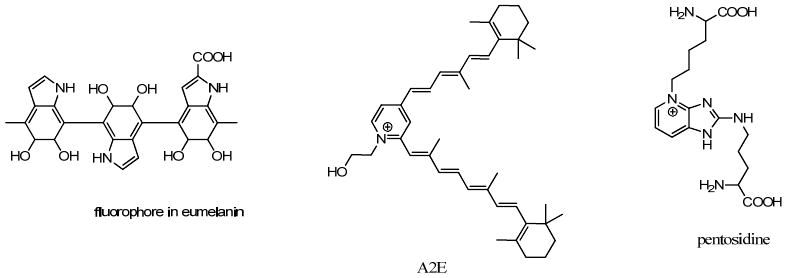
Major components in autofluorescent biological pigments.

Fluorescence intensity (left, gray color) and lifetime (right, false color) images of the mucosal surface of a piece of freshly resected normal human stomach (ex. 355 nm). In the top right corner of the piece of tissue, the mucosa was removed to reveal the underlying collagen-rich muscularis propria. The gastric mucosa has a short, homogeneous lifetime on the order of 1000 ps, compared to the longer lifetime of 1600 to 1800 ps of the muscularis propria. Copyright (year) (Name of Publisher) Reprinted from Ref. 461 Copyright 2005 SPIE.

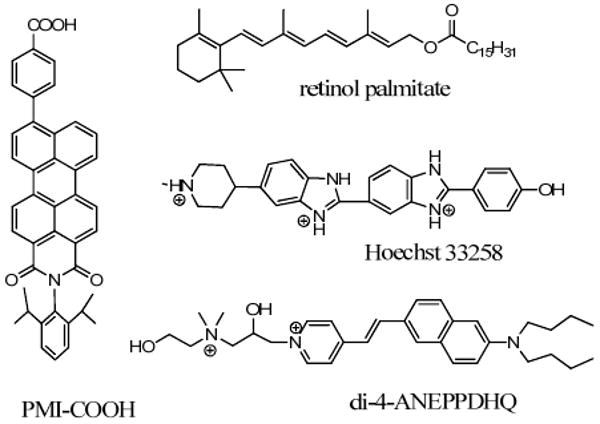
Structure of fluorescence compounds used in fluorescence lifetime imaging.
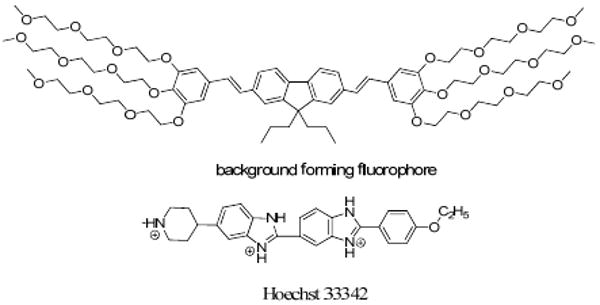
Structures and lifetime background forming compound (τ ∼ 1 ns) and Hoechst 33342 (τ ∼ 1.5 ns) in living CHO cells.

Fluorescence lifetime image of a muscle fiber incubated with 39-O-DEAC-pda-ATP. The fiber has a sarcomere length of 2.41 mm (myosin filament overlap 90% with actin). Reprinted from Ref. 330 Copyright 2007 Elsevier.

FLT map of mouse abdomen acquired 90 min after injection of 6 nmol LS-288 in vivo. The low FLT region in the center of the abdomen is the filled urinary bladder. Reprinted from Ref. 504 Copyright 2009 SPIE.

Fluorescence lifetime dependence of the MQAE fluorescence decay time in salivary ducts as a function of [Cl-]I indicated at bottom right in mM, ex. 750 nm, em. 400-600 nm. Reprinted from Ref. 341 Copyright 2009 The Royal Society of Chemistry (RSC) for the European Society for Photobiology, the European Photochemistry Association, and the RSC.

Fluorescent lifetime Zn2+ Newport Green DCF has a lifetime of 2.93 at high zinc concentrations and 0.88 ns at low zinc concentrations.

Fluorescence lifetime imaging of distal dendrites of a Purkinje fiber before (baseline), during (stimulation), and after (recovery) cell long-lasting dendritic Ca2+ signals. Concentrations of Ca2+ were calculated from lifetime-concentration studies in vitro. Reprinted from Ref. 348 Copyright 2006 Elsevier.

Time-resolved fluorescence images of liposomes containing NBD-PE (energy donor) in the presence (upper liposome) and absence (lower liposome) of the energy acceptor, LRB-PE. The color scale ranges from 0 (dark blue) to 11 nsec (red) in the linear scale. Each figure is 15 um wide. Reprinted from Ref. 358 Copyright 1993 Elsevier.

Fluorescence lifetime imaging (ex. 800 nm) of LRP-sorLA interactions in perinuclear compartments of primary rat neurons. Red dots with shorter lifetime indicate the location of FRET between Alexa488 and Cy3. Reprinted from Ref. 369 Copyright 2009 Elsevier.

Histograms of the lifetime of EGFP in HeLa cells. Induced apoptosis caused a shift in lifetime to lower values. Ex/em 440/515–560 nm. Reprinted from Ref. 409 Copyright 2009 The Royal Society of Chemistry (RSC) for the European Society for Photobiology, the European Photochemistry Association, and the RSC.

Proposed model Ca2+ probe composed from of circular permutated fluorescent protein with Ca2+ sensitive domain (calmodulin and M13). Reprinted from Ref. 413 Copyright 2007 BioMed Central.

A simplified mechanism of multiexciton state in quantum dots causing a multiexponential lifetime, green – electrons, red – holes.

Molecular oxygen sensors: Ru(bpy)3 2+, Gd-porphyrin complex and singlet oxygen sensor MTTA-Eu3+ (the reaction of MTTA-Eu3+ with 1O2 is shown450).
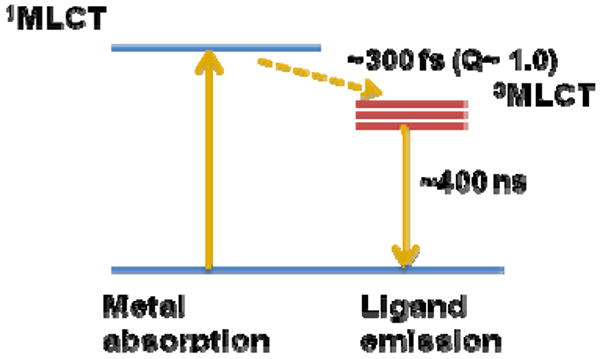
Mechanism of Ru(bpy)32 emission.
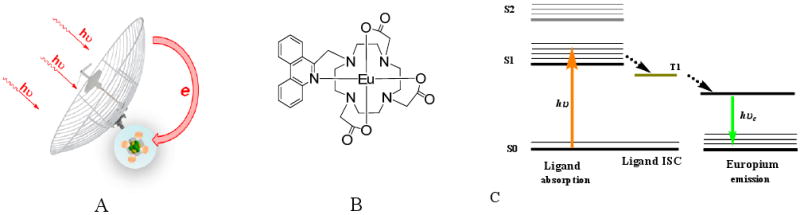
A concept of a lanthanide emissive construct (A), structure of typical lanthanide complex (B) and the mechanism of emission (C).

Lifetime map showing silica particles labeled with a Eu(III) complex and suspended in water Reprinted from Ref. 545 Copyright 2000 Elsevier.

Long lifetime NIR lanthanide Nd(III)- (em. 950 and 1340 nm) based cyclen-ruthenium coordination conjugates and distribution of their lifetimes. Reprinted with permission from ref. Copyright 2006 Reprinted from Ref. 546 Copyright 2006 American Chemical Society.

Schematics of an upconversion mechanism for Eu(III) complex.

Structure of molecules and fluorescence lifetime images (a) FLIM map of live HEK293 cells stained with di-4-ANEPPDHQ showing membranes with different orders, Reprinted from Ref. 107 Copyright 2006 Elsevier; (b) obtained for PMI-COOH in: top normal Jurkat cell; bottom: Jurkat cell after cholesterol extraction using methyl- β –cyclodextrin, Reprinted from Ref. 475 Copyright 2007 Elsevier.

Fluorescence lifetime images of FAD in vivo, normal (A) low-grade precancer (B) and high-grade precancer (C) squamous epithelium tissues (ex. 890 nm, 400-600 nm emission). The number in the corner indicates depth in μm. Reprinted from Ref. 488 Copyright 2007 National Academy of Sciences, U.S.A.

Time-gated intensity images of breast tissue after staining with H&E. (A) Grade 2 invasive ductal carcinoma with desmoplastic stroma. (B) Benign dense collagen and benign epithelium. (C) Vessel (venous). The elastic tissue in the malignancy-associated stroma and the elastic tissue of blood vessels give an extraordinarily bright signal. Reprinted from Ref. 490 Copyright 2003 Wiley-Blackwell.

FLIM image obtained following 467 nm pulsed excitation of SK-OV-3 cells (A 1.6 ns fluorescence lifetime corresponds to the average intracellular viscosity value of (140±40) cP. Reprinted from Ref. 101 Copyright 2008 American Chemical Society

FLIM images generated using NADH autofluorescence in the human cortex showing neurons. The bright, punctate spots are NADH-rich mitochondria containing primarily long lifetime bound NADH (blue, 3000 ps - 6000 ps) and unbound NADH (red, ∼300 ps) that are localized in the cytoplasm. Neuropil is composed largely of small-enzyme bound NADH (green, ∼560 ps). Scale bar = 20 μm. Ex/em: 769/<555 nm. Reprinted from Ref. 506 Copyright 2008 Optical Society of America.
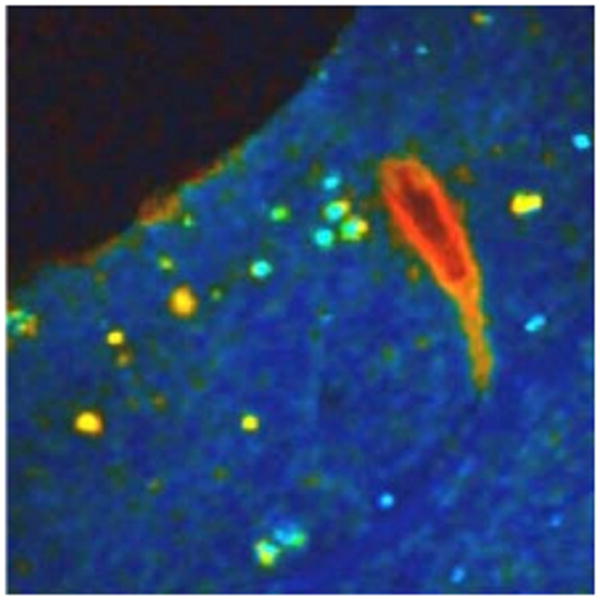
Fluorescence lifetime imaging of APP transgenic mouse brain sections. Vascular amyloid stains at a short lifetime (red), plaques at a medium lifetime (orange to green), and background neuropil at an even longer lifetime (blue). Reprinted from Ref. 296 Copyright 2008 Springer Science+Business Media.

FLIM images of rat aorta lumen showing the lifetime maps, measured with 390 nm (left), 450 nm (middle), and 550 nm (right), using bandpass filters. The arrows indicate an area rich in elastin, ex. 337 nm. Reprinted from Ref. 220 Copyright 2007 IOP Publishing Ltd.

Fluorescence lifetime maps of NIR fluorescent nanoparticle in vivo at 0-5 days post-injection. Reprinted from Ref. 514 Copyright 2008 American Chemical Society.

Cumulative distribution function on the average lifetime distributions for different yeast strains A9, Y275, K7 and A13, ex/em. 405/440-540 nm. Reprinted from Ref. 520 Copyright 2008 Wiley-Blackwell.

Fluorescence lifetime images of an apple artificially contaminated with the three feces spots (Ex/em 418/670 nm). Reprinted from Ref. 214 Copyright 2008 Optical Society of America.
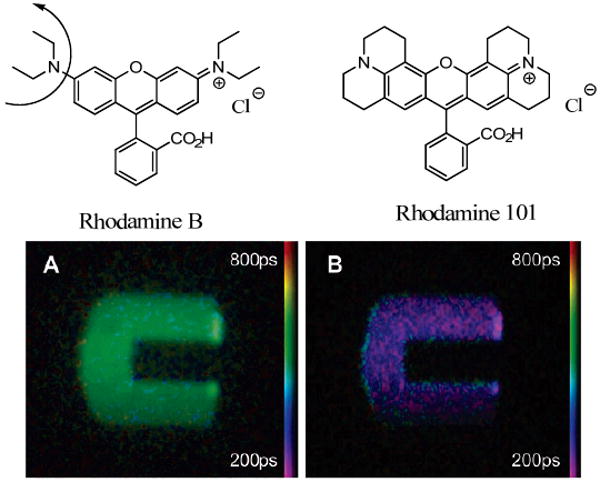
Structures and fluorescence lifetime images of methanolic solutions of Rhodamine B in microchannels. Fluorescence lifetime images at 66 °C (A) and 93 °C (B). Reprinted from Ref. 528 Copyright 2006 American Chemical Society.

The intensity image (a) and fluorescence lifetime image (b) of the blitz-green-treated finger mark samples on postcard substrate. Reprinted from Ref. 532 Copyright 2006 Elsevier.
References
-
- McGown LB, Nithipatikom K. Appl Spectrosc Rev. 2000;35:353.
-
- Chen Y, Periasamy A. Microsc Res Tech. 2004;63:72. - PubMed
-
- Lakowicz JR. Principles of fluorescence spectroscopy. 3rd. Springer; New York: 2006.
-
- Becker W, Bergmann A, Biskup C. Microsc Res Tech. 2007;70:403. - PubMed
-
- Becker W, Bergmann A. In: Handbook of Biomedical Nonlinear Optical Microscopy. Master BR, So P, editors. Oxford University Press, USA; New York, NY: 2008.
Publication types
MeSH terms
Substances
Grants and funding
LinkOut - more resources
Full Text Sources
Other Literature Sources
