. 2010 Mar 31:9:71.
doi: 10.1186/1476-4598-9-71.

Autotaxin expression and its connection with the TNF-alpha-NF-kappaB axis in human hepatocellular carcinoma

Affiliations

Autotaxin expression and its connection with the TNF-alpha-NF-kappaB axis in human hepatocellular carcinoma

Jian-Min Wu et al. Mol Cancer. .

Abstract

Background: Autotaxin (ATX) is an extracellular lysophospholipase D that generates lysophosphatidic acid (LPA) from lysophosphatidylcholine (LPC). Both ATX and LPA have been shown to be involved in many cancers. However, the functional role of ATX and the regulation of ATX expression in human hepatocellular carcinoma (HCC) remain elusive.

Results: In this study, ATX expression was evaluated in tissues from 38 human HCC and 10 normal control subjects. ATX was detected mainly in tumor cells within tissue sections and its over-expression in HCC was specifically correlated with inflammation and liver cirrhosis. In addition, ATX expression was examined in normal human hepatocytes and liver cancer cell lines. Hepatoma Hep3B and Huh7 cells displayed stronger ATX expression than hepatoblastoma HepG2 cells and normal hepatocytes did. Proinflammtory cytokine tumor necrosis factor alpha (TNF-alpha) promoted ATX expression and secretion selectively in Hep3B and Huh7 cells, which led to a corresponding increase in lysophospholipase-D activity. Moreover, we explored the mechanism governing the expression of ATX in hepatoma cells and established a critical role of nuclear factor-kappa B (NF-kappaB) in basal and TNF-alpha induced ATX expression. Further study showed that secreted enzymatically active ATX stimulated Hep3B cell invasion.

Conclusions: This report highlights for the first time the clinical and biological evidence for the involvement of ATX in human HCC. Our observation that links the TNF-alpha/NF-kappaB axis and the ATX-LPA signaling pathway suggests that ATX is likely playing an important role in inflammation related liver tumorigenesis.


Figures

Figure 1
Figure 1
Representative microphotographs of immunohistochemical analysis of ATX antigen expression in human normal liver and HCC tissue. A, B, normal control liver (NL). C, D, HCCs developed from normal liver background with neither inflammatory lesion nor well-established risk factors, and were classified as normal-HCC (N-HCC). E, F, Hepatitis B-related HCC (HBV-HCC). G, H, hepatitis C-related HCC (HCV-HCC). I, J, nonalcoholic steatohepatitis (NASH) related-HCC (NASH-HCC). No detectable ATX antigen expression was observed in hepatocytes of normal liver although a small portion of stromal cells showed weak ATX immunoreactivity (A and B, blue arrow). Intense and widespread ATX immunoreactivity was observed in the cytoplasm of tumor cells in HBV-, HCV- or NASH-associated HCC (E-J, red arrow). Weak ATX immunoreactivity was observed in the tumor cells of N-HCC (C and D, blue arrow). A, C, E, G, and I, original magnification, × 200; B, D, F, H and J, original magnification, × 400. Images were captured with a Leica DM5000 B system (Leica Microsystems).
Figure 2
Figure 2
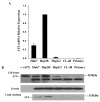
Differential expression of ATX in human liver cancer cell lines (Huh7, Hep3B and HepG2), normal embryonic liver cell line CL-48, and normal primary hepatocytes. A. Comparison of ATX mRNA levels by qRT-PCR analysis. Columns are average ± SD from three independent experiments. B. Equal number of cells (4 × 10⁵) were plated into 100 mm dishes and incubated in serum free EMEM containing 0.1% BSA for 24 hours. Cells were lysed with RIPA buffer and 15 μg of lysates was used for SDS-PAGE and probed for ATX antibody, β-actin level was used as a loading control (top two pannels). 1/10 volume of concentrated medium was used for immunoblot (bottom panel). An intense band of 110 kDa was detected in the cell lysate from Hep3B and Huh7 cells, which is corresponding to the positive ATX control. The sizes of the MW markers are shown on the right. rATX indicates recombinant ATX protein which is a positive control. IB indicates immunoblot.
Figure 3
Figure 3
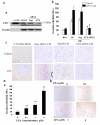
TNF-α induces ATX expression and secretion selectively in hepatoma cell lines Hep3B and Huh7. A. Effect of TNF-α on the expression of ATX. Serum starved cells were treated with or without TNF-α (10 ng/ml) for 16 hours. Results are the mean ± SD from three QRT-PCR experiments. **, P < 0.01. B. Starved Hep3B or Huh7 cells were treated with TNF-α (10 ng/ml) for 20 hours. Cell culture medium and cell lysates were collected. 15 μg cell lysate were used for immunoblot analysis. IB indicates immunoblot.
Figure 4
Figure 4
Up-regulation of ATX induced by TNF-α is associated with increased lysophospholipase D (lyso-PLD) activity by conversion of LPC into LPA in Hep3B and Huh7 cells. Serum starved Hep3B or Huh7 cells were treated with TNF-α (10 ng/ml) or vehicle (0.1%BSA/PBS) for 20 hours. A. Conditioned media (CM) or control media (DMEM or EMEM) were concentrated (40-fold) and assayed for ATX activity using the FS-3 compound. The results are shown as the average of relative fluorescence activity ± SD from three experiments. B. CM were incubated with 15 μM LPC (18:1) for 3 hours at 37°C. Lipids were analyzed by liquid chromatography-mass spectrometry (LC-MS). Results are level of LPA (18:1) from three experiments and presented as mean ± SD. *, P < 0.05.
Figure 5
Figure 5
Secreted enzymatically active ATX promoted Hep3B cell invasion. A. a, Hep3B cells were transfected with ATX siRNA or negative siRNA, and ATX expression was examined by immunoblot. b, serum starved Hep3B cells were chemoattracted by MEM/0.1% fatty acid-free BSA or conditioned media (CM) plus or minus 1 μM LPC (18:1). Neg. CM, CM from Hep3B cells transfected with negative siRNA. 3B CM, CM from Hep3B cells; ATX siRNA CM, CM from Hep3B cells transfected with ATX siRNA. Each sample was tested in triplicate and results are reported as mean ± SD of invaded cells of two independent experiments, bars, SD. *, P < 0.05. c, representative fields of invaded and stained cells. B. a, starved Hep3B cells were chemoattracted by various doses of LPA and representative fields of invaded cells are shown in b. **, P < 0.01.
Figure 6
Figure 6
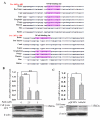
NF-κB mediates the basal expression of ATX. A. Alignment of the ATX promoter region 2000 nt upstream of the transcription start site from 9 eutherian mammals. Two highly conservative consensus sequences for NF-κB binding sites are identified. B. Starved Hep3B cells were treated with parthenolide (0, 2.5 or 5 μM) for 16 hours. C. ATX expression in stable cell line Hep3B-IκBαSR which NF-κB activity was blocked by mutant IκBα (IκBαSR). Vector infected cell line Hep3B-pQCXIN served as control; IκBαSR indicates Hep3B-IκBαSR cells; pQCXIN indicates Hep3B-pQCXIN cells. ATX mRNA expression was determined by qRT-PCR (top panel in B, C), Values are the mean ± SD of three experiments. ** P < 0.01, * P < 0.05. ATX protein expression was determined by immunoblot (IB) (Bottom panel in B, C). β-actin expression was used as a loading control.
Figure 7
Figure 7
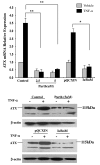
NF-κB mediates TNF-α-induced expression of ATX. Parthenolide pretreated Hep3B cells (4 hours), and stable cell lines Hep3B-IκBαSR and Hep3B-pQCXIN were stimulated with or without 10 ng/mL human TNF-α for 16 hours. ATX mRNA expression was determined by qRT-PCR (top panel), Values are the mean ± SD of three experiments. ** P < 0.01, * P < 0.05. ATX protein expression was determined by immunoblot (IB) (Bottom panel). β-actin expression was used as a loading control.

References

    1. Greten TF, Korangy F, Manns MP, Malek NP. Molecular therapy for the treatment of hepatocellular carcinoma. Br J Cancer. 2009;100:19–23. doi: 10.1038/sj.bjc.6604784. - DOI - PMC - PubMed
    1. Altekruse SF, McGlynn KA, Reichman ME. Hepatocellular carcinoma incidence, mortality, and survival trends in the United States from 1975 to 2005. J Clin Oncol. 2009;27:1485–1491. doi: 10.1200/JCO.2008.20.7753. - DOI - PMC - PubMed
    1. Cooper AB, Wu JM, Lu D, Maluccio MA. Is Autotaxin (ENPP2) the Link between Hepatitis C and hepatocellular carcinoma? J Gastrointest Surg. 2007;11:1628–1634. doi: 10.1007/s11605-007-0322-9. - DOI - PubMed
    1. Watanabe N, Ikeda H, Nakamura K, Ohkawa R, Kume Y, Tomiya T, Tejima K, Nishikawa T, Arai M, Yanase M. Plasma ysophosphatidic acid level and serum autotaxin activity are increased in liver injury in rats in relation to its severity. Life Sci. 2007;81:1009–1015. doi: 10.1016/j.lfs.2007.08.013. - DOI - PubMed
    1. Stracke ML, Krutzsch HC, Unsworth EJ, Arestad A, Cioce V, Schiffmann E, Liotta LA. Identification, purification, and partial sequence analysis of autotaxin, a novel motility-stimulating protein. J Biol Chem. 1992;267:2524–2529. - PubMed

Publication types

MeSH terms