

Crystal structure of HLA-DP2 and implications for chronic beryllium disease
- PMID: 20356827
- PMCID: PMC2867715
- DOI: 10.1073/pnas.1001772107
Crystal structure of HLA-DP2 and implications for chronic beryllium disease
Abstract
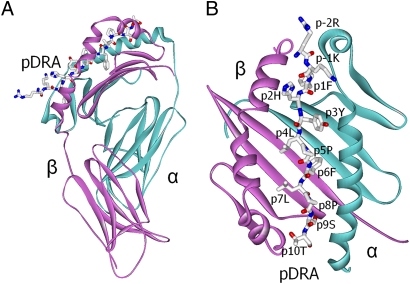
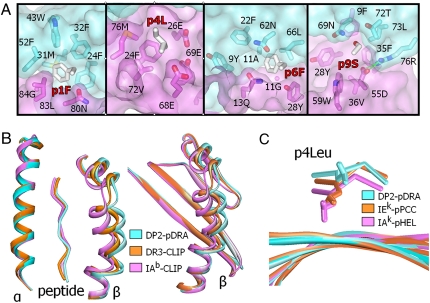
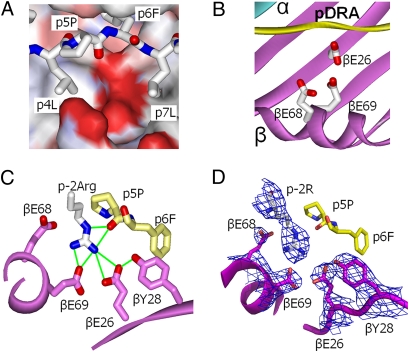
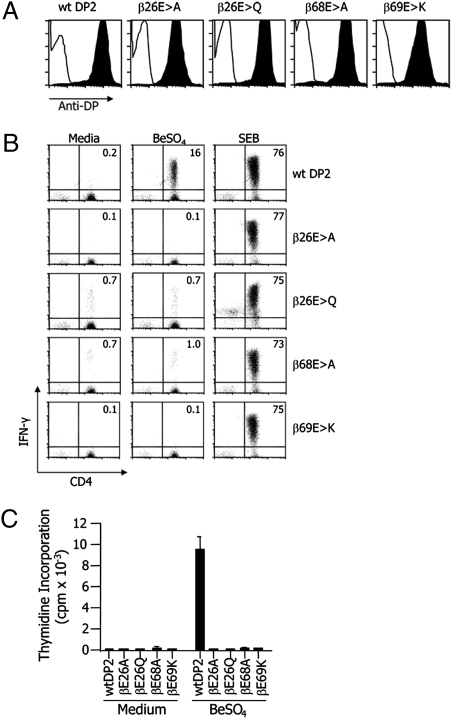
Chronic beryllium disease (CBD) is a fibrotic lung disorder caused by beryllium (Be) exposure and is characterized by granulomatous inflammation and the accumulation of Be-responsive CD4(+) T cells in the lung. Genetic susceptibility to CBD has been associated with certain alleles of the MHCII molecule HLA-DP, especially HLA-DPB1*0201 and other alleles that contain a glutamic acid residue at position 69 of the beta-chain (betaGlu69). The HLA-DP alleles that can present Be to T cells match those implicated in the genetic susceptibility, suggesting that the HLA contribution to disease is based on the ability of those molecules to bind and present Be to T cells. The structure of HLA-DP2 and its interaction with Be are unknown. Here, we present the HLA-DP2 structure with its antigen-binding groove occupied by a self-peptide derived from the HLA-DR alpha-chain. The most striking feature of the structure is an unusual solvent exposed acidic pocket formed between the peptide backbone and the HLA-DP2 beta-chain alpha-helix and containing three glutamic acids from the beta-chain, including betaGlu69. In the crystal packing, this pocket has been filled with the guanidinium group of an arginine from a neighboring molecule. This positively charged moiety forms an extensive H-bond/salt bridge network with the three glutamic acids, offering a plausible model for how Be-containing complexes might occupy this site. This idea is strengthened by the demonstration that mutation of any of the three glutamic acids in this pocket results in loss of the ability of DP2 to present Be to T cells.
Conflict of interest statement
The authors declare no conflict of interest.
Figures
Similar articles
-
Linking genetic susceptibility and T cell activation in beryllium-induced disease.Proc Am Thorac Soc. 2010 May;7(2):126-9. doi: 10.1513/pats.201002-022RM. Proc Am Thorac Soc. 2010. PMID: 20427584 Free PMC article. Review.
-
Metal-specific CD4+ T-cell responses induced by beryllium exposure in HLA-DP2 transgenic mice.Mucosal Immunol. 2016 Jan;9(1):218-28. doi: 10.1038/mi.2015.54. Epub 2015 Jul 1. Mucosal Immunol. 2016. PMID: 26129650 Free PMC article.
-
Beryllium presentation to CD4+ T cells is dependent on a single amino acid residue of the MHC class II beta-chain.J Immunol. 2005 Nov 15;175(10):7029-37. doi: 10.4049/jimmunol.175.10.7029. J Immunol. 2005. PMID: 16272364
-
T cell recognition of beryllium.Curr Opin Immunol. 2013 Dec;25(6):775-80. doi: 10.1016/j.coi.2013.07.012. Epub 2013 Aug 23. Curr Opin Immunol. 2013. PMID: 23978481 Free PMC article. Review.
-
Recombinant HLA-DP2 binds beryllium and tolerizes beryllium-specific pathogenic CD4+ T cells.J Immunol. 2006 Sep 15;177(6):3874-83. doi: 10.4049/jimmunol.177.6.3874. J Immunol. 2006. PMID: 16951350
Cited by
-
Predicting nonspecific ion binding using DelPhi.Biophys J. 2012 Jun 20;102(12):2885-93. doi: 10.1016/j.bpj.2012.05.013. Epub 2012 Jun 19. Biophys J. 2012. PMID: 22735539 Free PMC article.
-
CD4+ T cells in the lungs of acute sarcoidosis patients recognize an Aspergillus nidulans epitope.J Exp Med. 2021 Oct 4;218(10):e20210785. doi: 10.1084/jem.20210785. Epub 2021 Aug 19. J Exp Med. 2021. PMID: 34410304 Free PMC article.
-
Non-overlapping epitopes on the gHgL-gp42 complex for the rational design of a triple-antibody cocktail against EBV infection.Cell Rep Med. 2023 Nov 21;4(11):101296. doi: 10.1016/j.xcrm.2023.101296. Cell Rep Med. 2023. PMID: 37992686 Free PMC article.
-
HLA-II immunopeptidome profiling and deep learning reveal features of antigenicity to inform antigen discovery.Immunity. 2023 Jul 11;56(7):1681-1698.e13. doi: 10.1016/j.immuni.2023.05.009. Epub 2023 Jun 9. Immunity. 2023. PMID: 37301199 Free PMC article.
-
Proteomic studies of putative molecular signatures for biological effects by Korean Red Ginseng.J Ginseng Res. 2019 Oct;43(4):666-675. doi: 10.1016/j.jgr.2019.05.001. Epub 2019 May 11. J Ginseng Res. 2019. PMID: 31700262 Free PMC article.
References
-
- Jones EY, Fugger L, Strominger JL, Siebold C. MHC class II proteins and disease: A structural perspective. Nat Rev Immunol. 2006;6:271–282. - PubMed
-
- Nepom GT. Major histocompatibility complex-directed susceptibility to rheumatoid arthritis. Adv Immunol. 1998;68:315–332. - PubMed
-
- Nepom GT, Erlich H. MHC class-II molecules and autoimmunity. Annu Rev Immunol. 1991;9:493–525. - PubMed
-
- Dong RP, et al. HLA-A and DPB1 loci confer susceptibility to Graves’ disease. Hum Immunol. 1992;35:165–172. - PubMed
Publication types
MeSH terms
Substances
Associated data
- Actions
Grants and funding
- R01 AI018785/AI/NIAID NIH HHS/United States
- P01 ES011810/ES/NIEHS NIH HHS/United States
- AI18785/AI/NIAID NIH HHS/United States
- HHMI/Howard Hughes Medical Institute/United States
- T32 AI007405/AI/NIAID NIH HHS/United States
- HL62410/HL/NHLBI NIH HHS/United States
- K24 HL102245/HL/NHLBI NIH HHS/United States
- R01 AI017134/AI/NIAID NIH HHS/United States
- R37 AI018785/AI/NIAID NIH HHS/United States
- R56 AI018785/AI/NIAID NIH HHS/United States
- P01 AI022295/AI/NIAID NIH HHS/United States
- R01 HL062410/HL/NHLBI NIH HHS/United States
- ES11810/ES/NIEHS NIH HHS/United States
- R56 AI017134/AI/NIAID NIH HHS/United States
- AI17134/AI/NIAID NIH HHS/United States
LinkOut - more resources
Full Text Sources
Molecular Biology Databases
Research Materials
