. 2010 May 28;285(22):16530-7.
doi: 10.1074/jbc.M109.092593. Epub 2010 Mar 31.

The mitochondrial 2-oxoglutarate carrier is part of a metabolic pathway that mediates glucose- and glutamine-stimulated insulin secretion

Affiliations

The mitochondrial 2-oxoglutarate carrier is part of a metabolic pathway that mediates glucose- and glutamine-stimulated insulin secretion

Matthew L Odegaard et al. J Biol Chem. .

Abstract

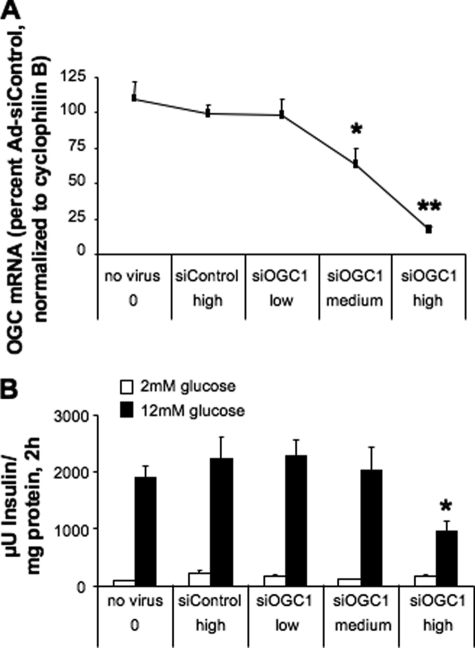
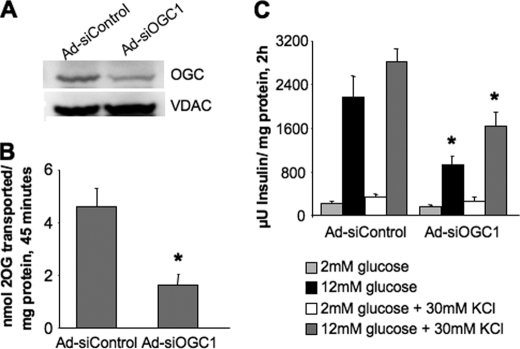
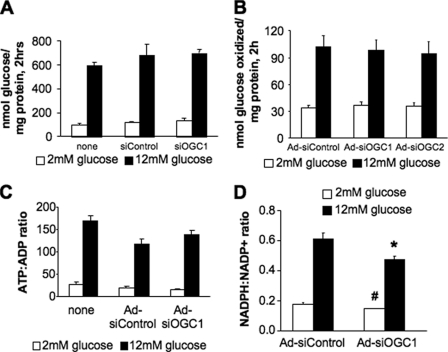
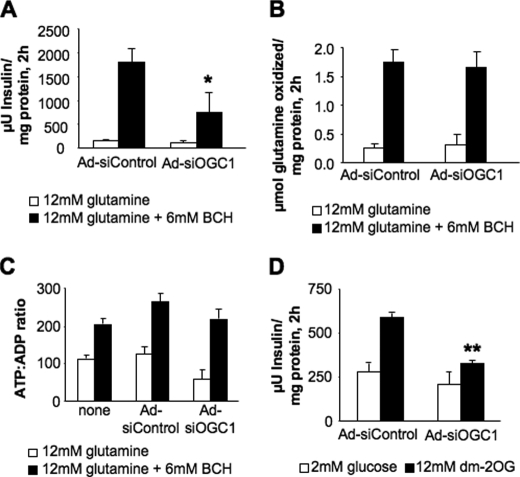
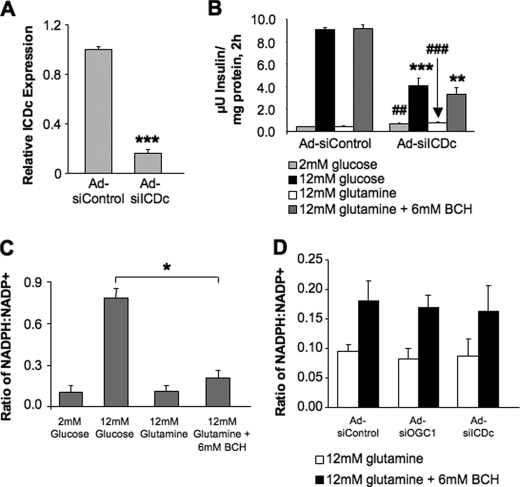
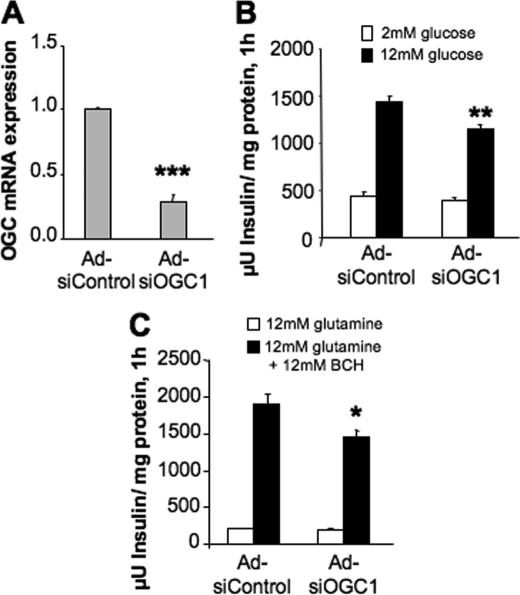
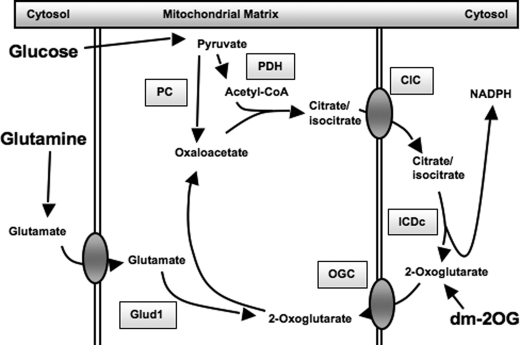
Glucose-stimulated insulin secretion from pancreatic islet beta-cells is dependent in part on pyruvate cycling through the pyruvate/isocitrate pathway, which generates cytosolic alpha-ketoglutarate, also known as 2-oxoglutarate (2OG). Here, we have investigated if mitochondrial transport of 2OG through the 2-oxoglutarate carrier (OGC) participates in control of nutrient-stimulated insulin secretion. Suppression of OGC in clonal pancreatic beta-cells (832/13 cells) and isolated rat islets by adenovirus-mediated delivery of small interfering RNA significantly decreased glucose-stimulated insulin secretion. OGC suppression also reduced insulin secretion in response to glutamine plus the glutamate dehydrogenase activator 2-amino-2-norbornane carboxylic acid. Nutrient-stimulated increases in glucose usage, glucose oxidation, glutamine oxidation, or ATP:ADP ratio were not affected by OGC knockdown, whereas suppression of OGC resulted in a significant decrease in the NADPH:NADP(+) ratio during stimulation with glucose but not glutamine + 2-amino-2-norbornane carboxylic acid. Finally, OGC suppression reduced insulin secretion in response to a membrane-permeant 2OG analog, dimethyl-2OG. These data reveal that the OGC is part of a mechanism of fuel-stimulated insulin secretion that is common to glucose, amino acid, and organic acid secretagogues, involving flux through the pyruvate/isocitrate cycling pathway. Although the components of this pathway must remain intact for appropriate stimulus-secretion coupling, production of NADPH does not appear to be the universal second messenger signal generated by these reactions.


Figures

FIGURE 1.
FIGURE 1.
Effects of OGC suppression on GSIS in 832/13 cells. Expression of OGC was suppressed in 832/13 cells using Ad-siOGC#1 in a dose-dependent manner. A, low, medium, and high doses of Ad-siOGC#1 adenovirus (5, 25, and 50 plaque-forming units of virus/cell, respectively) dose-dependently reduced OGC RNA relative to both a no virus control and cells treated with the Ad-siControl virus. B, effects of Ad-siOGC#1 on OGC expression corresponded with decreased glucose-stimulated insulin secretion. Data represent the mean ± S.E. for three independent experiments. *, p < 0.05, **, p < 0.01 as compared with Ad-siControl.
FIGURE 2.
FIGURE 2.
Effects of OGC suppression on protein expression, transporter activity, and KCl-stimulated insulin secretion. Expression of OGC was suppressed in 832/13 cells using the highest dose of Ad-siOGC#1 described in Fig. 1. Ad-siOGC#1 decreased OGC protein expression (A) and OGC transporter activity (B). C, GSIS in the presence or absence of KCl was measured to identify metabolic versus nonmetabolic effects on secretion. Comparisons were made between Ad-siControl and Ad-siOGC#1 for each stimulation condition. Data for B and C represent the mean ± S.E. for three and four independent experiments, respectively. *, p < 0.05 as compared with Ad-siControl. VDAC, voltage-dependent anion-selective channel protein-1.
FIGURE 3.
FIGURE 3.
Effects of OGC suppression on glucose oxidation, glucose usage, ATP production, and NADPH generation. The OGC was suppressed in 832/13 cells, and the effects on metabolic parameters were determined. A, glucose usage (glycolytic flux) was measured from cells treated with siOGC1 and compared with cells either left untreated or transfected with siControl duplexes. B, glucose oxidation was measured after treatment with Ad-siOGC#1 or Ad-siOGC#2 and compared with oxidation in cells treated with Ad-siControl. C, ATP:ADP ratio at 2 and 12 mm glucose, in cells treated with Ad-siOGC#1, compared with a no virus control and the Ad-siControl. D, NADPH:NADP+ ratio at 12 versus 2 mm glucose. Data represent the mean ± S.E. of four, three, three, and four independent experiments, respectively. #, p < 0.01, and *, p < 0.05 as compared with low glucose and high glucose Ad-siControl, respectively.
FIGURE 4.
FIGURE 4.
Effects of OGC suppression on glutamine-stimulated insulin secretion and metabolism, and DM-2OG-stimulated insulin secretion. The effects of OGC suppression on glutamine-stimulated insulin secretion and metabolism were determined. A, glutamine-stimulated insulin secretion; B, glutamine oxidation; C, ATP:ADP ratio in the presence of glutamine alone or glutamine + BCH. D, DM (dm)-2OG-stimulated insulin secretion after OGC suppression. Data represent the mean ± S.E. for three to eight independent experiments per panel. *, p < 0.05; **, p < 0.01 as compared with Ad-siControl.
FIGURE 5.
FIGURE 5.
Effects of OGC and ICDc suppression on NADPH:NADP ratio during glucose- and glutamine-stimulated insulin secretion. The cytosolic NADP-dependent enzyme ICDc was suppressed in 832/13 cells, and the effects on glutamine-stimulated insulin secretion were measured. A, expression of ICDc as determined by real time PCR. B, effects of ICDc suppression on insulin secretion after stimulation with glucose or glutamine + BCH. C, NADPH:NADP+ ratio in 832/13 β-cells stimulated with low glucose, high glucose, glutamine alone, and glutamine + BCH. D, NADPH:NADP ratio during glutamine-stimulated insulin secretion, following treatment of cells with Ad-siControl, Ad-siOGC#1, or Ad-siICDc. Data represent the mean ± S.E. for three independent experiments for each panel. ##, p < 0.01, and ###, p < 0.001; *, p < 0.05; **, p < 0.01; ***, p < 0.001 as compared with low glucose and high glucose Ad-siControl, respectively.
FIGURE 6.
FIGURE 6.
Effects of OGC suppression in rat pancreatic islets. OGC was suppressed in isolated rat pancreatic islets. A, OGC mRNA expression after treatment with Ad-siOGC. B, GSIS; C, glutamine-stimulated insulin secretion after OGC suppression. Data represent the mean ± S.E. of five, five, and four independent experiments, respectively. *, p < 0.05; **, p < 0.01; ***, p < 0.001 as compared with Ad-siControl.
FIGURE 7.
FIGURE 7.
Schematic overview of the pyruvate/isocitrate cycle and OGC, important components of the pathway regulating glucose- and glutamine-stimulated insulin secretion. The enzymes and transporters involved in pyruvate/isocitrate cycling are shown: pyruvate carboxylase (PC), pyruvate dehydrogenase (PDH). Glutamate dehydrogenase (Glud1) is also shown, along with the metabolic entry points for glucose, glutamine, and dimethyl-2-oxoglutarate (dm-2OG).

Similar articles

Cited by

References

    1. Ashcroft F. M., Harrison D. E., Ashcroft S. J. (1984) Nature 312, 446–448 - PubMed
    1. MacDonald P. E., Joseph J. W., Rorsman P. (2005) Philos. Trans. R. Soc. Lond. B Biol. Sci. 360, 2211–2225 - PMC - PubMed
    1. Bryan J., Crane A., Vila-Carriles W. H., Babenko A. P., Aguilar-Bryan L. (2005) Curr. Pharm. Des. 11, 2699–2716 - PubMed
    1. Newgard C. B., Matschinsky F. M. (2001) in Handbook of Physiology (Jefferson L. S., Cherrington A. eds) pp. 125–152, Oxford University Press, Oxford
    1. Henquin J. C. (2000) Diabetes 49, 1751–1760 - PubMed

Publication types