. 2010 May 28;285(22):17054-64.
doi: 10.1074/jbc.M109.099002. Epub 2010 Mar 31.

Discovery of the selective androgen receptor modulator MK-0773 using a rational development strategy based on differential transcriptional requirements for androgenic anabolism versus reproductive physiology

Affiliations

Discovery of the selective androgen receptor modulator MK-0773 using a rational development strategy based on differential transcriptional requirements for androgenic anabolism versus reproductive physiology

Azriel Schmidt et al. J Biol Chem. .

Abstract

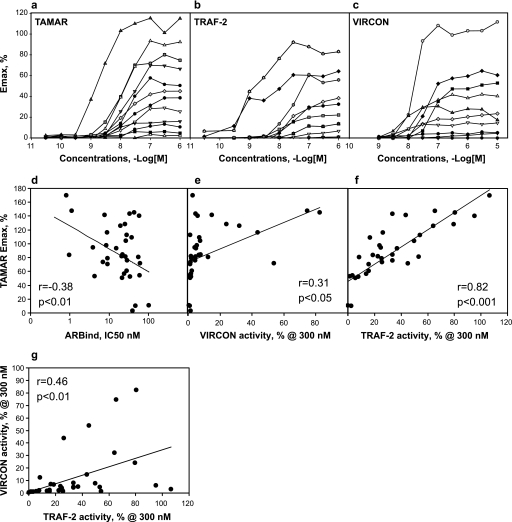
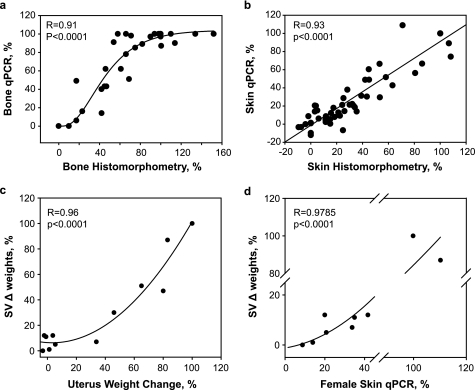
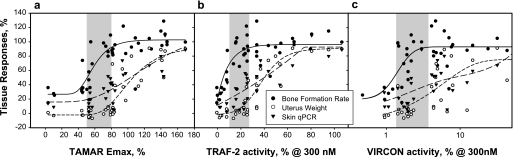
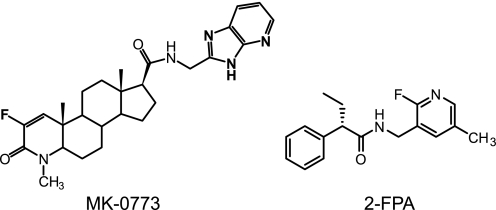
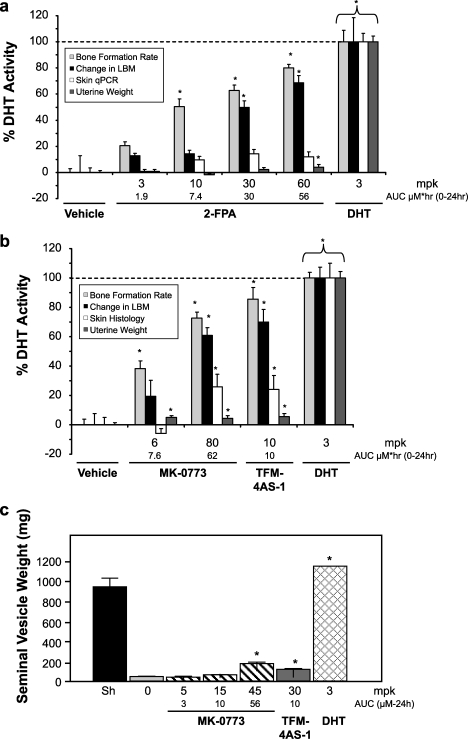
Selective androgen receptor modulators (SARMs) are androgen receptor (AR) ligands that induce anabolism while having reduced effects in reproductive tissues. In various experimental contexts SARMs fully activate, partially activate, or even antagonize the AR, but how these complex activities translate into tissue selectivity is not known. Here, we probed receptor function using >1000 synthetic AR ligands. These compounds produced a spectrum of activities in each assay ranging from 0 to 100% of maximal response. By testing different classes of compounds in ovariectomized rats, we established that ligands that transactivated a model promoter 40-80% of an agonist, recruited the coactivator GRIP-1 <15%, and stabilized the N-/C-terminal interdomain interaction <7% induced bone formation with reduced effects in the uterus and in sebaceous glands. Using these criteria, multiple SARMs were synthesized including MK-0773, a 4-aza-steroid that exhibited tissue selectivity in humans. Thus, AR activated to moderate levels due to reduced cofactor recruitment, and N-/C-terminal interactions produce a fully anabolic response, whereas more complete receptor activation is required for reproductive effects. This bimodal activation provides a molecular basis for the development of SARMs.


Figures

FIGURE 1.
FIGURE 1.
AR-mediated transcription assays identify ligands with diverse maximal agonistic activities. Examples of dose response treatments of AR ligands with diverse properties on three types of AR-controlled transcription assays (a–c) are shown. Each dose data point is an average of four treatments. a, shown is transactivation of MMTV-luciferase reporter via endogenous human AR in MDA-MB-453 cells (TAMAR). b, shown is transactivation mediated by the AF-2 domain of AR and potentiated by the coactivator GRIP-1 in COS-1 cells (TRAF-2). c, shown is the ligand-induced interaction between the AR C terminus with the N terminus using mammalian two-hybrid assay in CV-1 cells (VIRCON). d–g, correlations between the actions of various AR-ligands in vitro assays are shown. d, shown is the correlation between the Emax values of compounds in TAMAR assay (MMTV transactivation) and the AR binding affinities of various AR ligands (ARBIND). Ligand displacement assays with native AR is endogenously expressed in MDA-MB-453 cells as described (28). e, shown is the correlation between Emax values for compounds in TAMAR assay and the activities in VIRCON assay at 300 nm. VIRCON measures the AR N-C interactions. f, shown is the correlation between Emax values for compounds in TAMAR assay and the activities in TRAF-2 assay at 300 mm. TRAF-2 measures the transactivation mediated by AF-2 domain of AR potentiated by the coactivator (GRIP-1). g, correlation between Emax values for compounds in VIRCON and TRAF2 assays is shown. The regression and p value for 38 compounds are indicated in each panel. The regression and p value for the compounds are indicated in each panel.
FIGURE 2.
FIGURE 2.
Correlations between androgen actions on tissues measured via the use of biomarkers and histological analysis in eugonadal female and male rats. The histological studies and the RNA levels were measured in the skin and bones of the same OVX rats (a and b). a, the % increase in bone formation rate in the femur of OVX rats determined by histomorphometric analysis is plotted against the average regulation of the RNA for SCD1 and Col2A1 (Bone qPCR). b, the % increased in sebaceous gland area in skin of OVX rats is plotted against the average induction of SCD3 and SLQE in skin RNA (Skin qPCR). The actions of androgens in OVX rats predict their actions on male reproductive tissues in ORX rats (c and d). c, effects of SARMs on changes in uterus weights in OVX rats are plotted against the changes in SV weights of ORX rats. d, effects of SARMS on changes in skin of OVX rats are plotted against the changes in SVs in ORX rats. Skin changes were measured by the skin qPCR biomarker method. The values changed induced by 3 mg/kg/day DHT treatment compared with the values obtained in vehicle treated rats was set to 100%. The regression and p values for the compounds are indicated in each panel.
FIGURE 3.
FIGURE 3.
Correlations between the actions of androgens on tissues and their activities in transcription assays. The Emax values of compounds in each of the three transcription assays, TAMAR (a), TRAF2 (b), and VIRCON (c), are plotted against each their maximal effects on the increases in BFR measured by histomorphometry (solid circles and solid regression line), uterus weight (open circles and long-dash regression line), and sebaceous gland area measured by skin qPCR (solid triangles and short-dash regression line). The effects on BFR, uterus, and skin in OVX rats are shown as % activity relative to DHT (3 mg/kg), which is set to 100%. The regression values are: TAMAR versus BFR r = 0.82, uterus weight r = 0.89, skin qPCR r = 0.88; TRAF-2 versus BFR r = 0.83, uterus weight r = 0.83, skin qPCR r = 0.85; VIRCON versus BFR r = 0.68, uterus weight r = 0.75, skin qPCR r = 0.70. The p values for all are <0.0005.
FIGURE 4.
FIGURE 4.
Chemical structures of MK-0773 and 2-FPA. Shown are chemical structures of MK-0773 ((4aS,4bS,6aS,7S,9aS,9bS,11aR)-3-fluoro-N-(3H-imidazo[4,5-b]pyridin-2-ylmethyl)-1,4a,6a-trimethyl-2-oxo-2,4a,4b,5,6,6a,7,8,9,9a,9b,10,11,11a-tetradecahydro-1H-indeno[5,4-f]quinoline-7-carboxamide) and 2-FPA ((2S)-N-[(2-fluoro-5-methylpyridin-3-yl)methyl]-2-phenylbutanamide).
FIGURE 5.
FIGURE 5.
Tissue-selective effects of MK-0773 and 2-FPA in eugonadal rats. The effects of 2-FPA (a) and MK-0773 (b) and were measured in OVX rats that were treated at the given doses once daily for 24 days. Compound levels in plasma were measured in 3 separate animals at 0.25, 1, 2, 4, 8, and 24 h, and the area under the curve (AUC) was determined to allow comparison of 24 h exposures. Shown are the mean values for the various readouts of 10–12 animals + S.E. *, significantly different from ovariectomy + vehicle alone (p < 0.05, one way analysis of variance, Fisher's PLSD). All the data are expressed as percent of the activity obtained by treatment by 3 mg/kg/day DHT. Periosteal bone formation rate was measured by quantitative histomorphometry (percent double-labeled surface/total bone surface multiplied by mineral apposition rate). Uterine wet weight was used as a measure of androgen effects on reproductive organs. The change in LBM was measured by scanning the rats with quantitative NMR before and at the end of the treatments. The values for LBM are expressed as mean change from baseline compared with DHT. The effects on sebaceous gland area by MK-0773 were determined by quantitative histomorphometry of dorsal back skin. The effects on skin for 2-FPA were determined by skin qPCR assay. c, MK-0773 had a limited effect on seminal vesicles growth in ORX rats. ORX rats were treated daily with either vehicle, MK-0773, TFM-4AS-1, or DHT as indicated. For a comparison for normal androgen tone, a group of Sham (Sh) operated rats was treated with vehicle. The wet weights of the seminal vesicles were measured after treatments for 14 days. Compound levels in plasma were measured in 3 separate animals at 0.25, 1, 2, 4, 8, and 24 h, and the area under the curve was determined to allow comparison of 24 h exposures. Shown are the mean values of 10–16 animals ±S.E., *, significantly different from plus vehicle alone (p < 0.05, Kruskal-Wallis). mpk = mg/kg.

Similar articles

Cited by

References

    1. Harman S. M., Metter E. J., Tobin J. D., Pearson J., Blackman M. R. (2001) J. Clin. Endocrinol. Metab. 86, 724–731 - PubMed
    1. Bhasin S. (2003) J. Endocrinol. Invest. 26, 814–822 - PubMed
    1. Isidori A. M., Giannetta E., Pozza C., Bonifacio V., Isidori A. (2005) J. Endocrinol. Invest. 28, 73–79 - PubMed
    1. Stanworth R. D., Jones T. H. (2009) Front Horm. Res. 37, 74–90 - PubMed
    1. Bhasin S. (2003) J. Gerontol. A Biol. Sci. Med. Sci. 58, 1002–1008 - PubMed

Publication types

MeSH terms

Substances