. 2010 May 28;285(22):17218-34.
doi: 10.1074/jbc.M110.118638. Epub 2010 Mar 31.

Mouse Dfa is a repressor of TATA-box promoters and interacts with the Abt1 activator of basal transcription

Affiliations

Mouse Dfa is a repressor of TATA-box promoters and interacts with the Abt1 activator of basal transcription

Christopher S Brower et al. J Biol Chem. .

Abstract

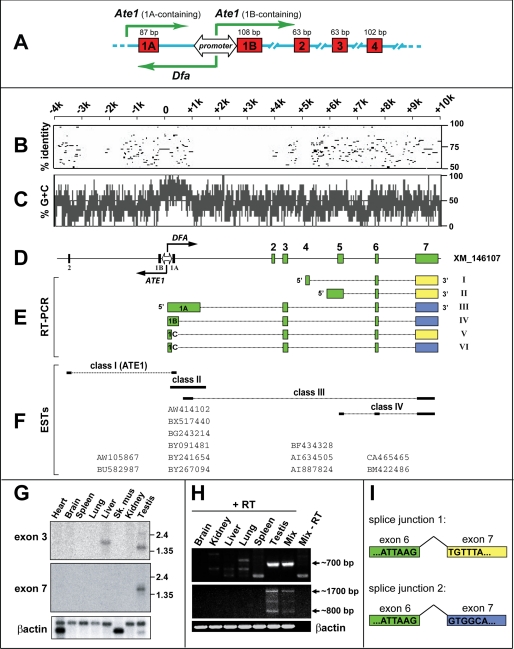
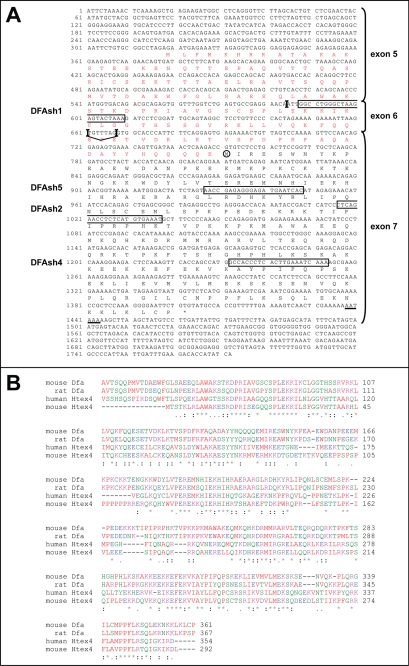
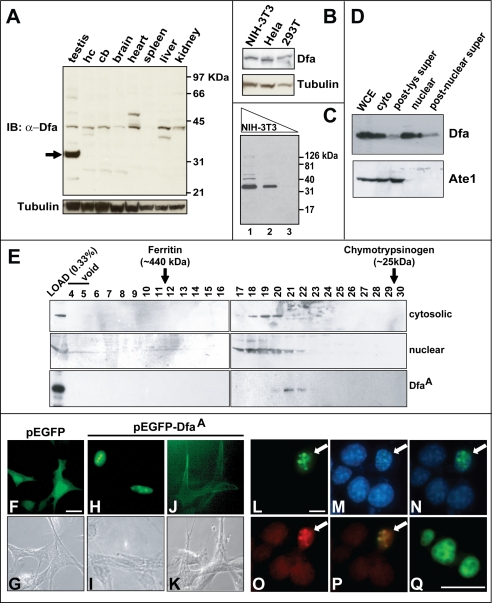
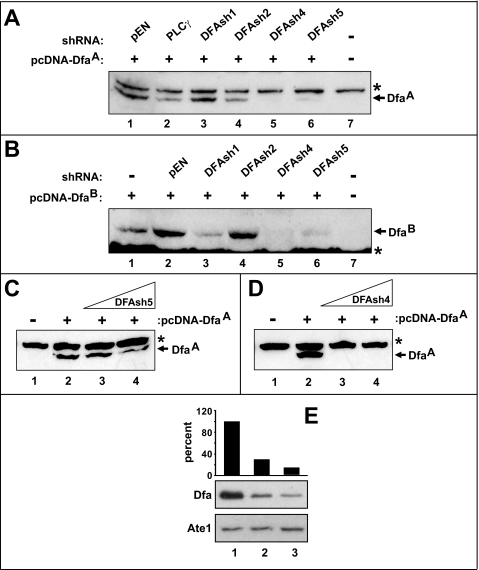
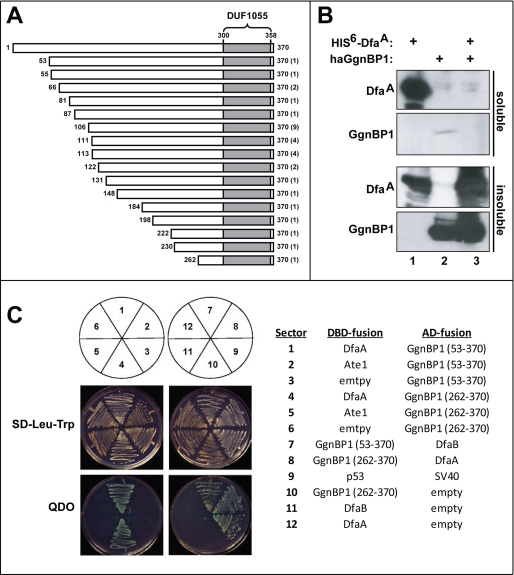
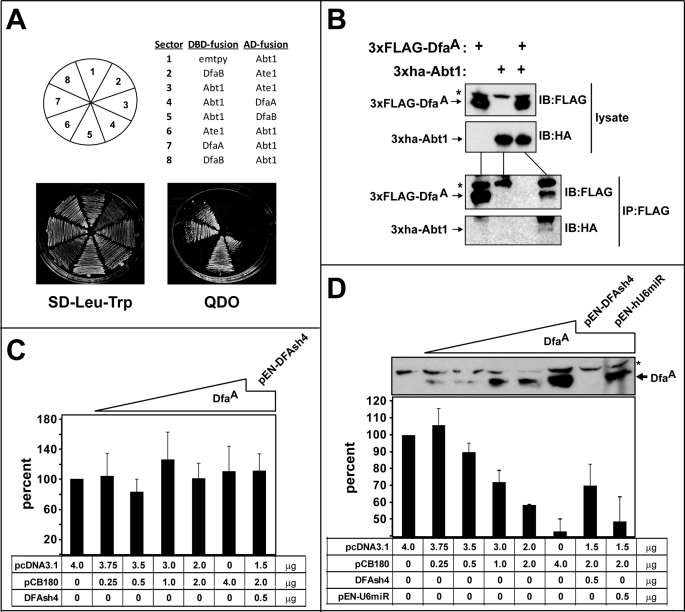
Our study of the mouse Ate1 arginyltransferase, a component of the N-end rule pathway, has shown that Ate1 pre-mRNA is produced from a bidirectional promoter that also expresses, in the opposite direction, a previously uncharacterized gene (Hu, R. G., Brower, C. S., Wang, H., Davydov, I. V., Sheng, J., Zhou, J., Kwon, Y. T., and Varshavsky, A. (2006) J. Biol. Chem. 281, 32559-32573). In this work, we began analyzing this gene, termed Dfa (divergent from Ate1). Mouse Dfa was found to be transcribed from both the bidirectional P(Ate1/Dfa) promoter and other nearby promoters. The resulting transcripts are alternatively spliced, yielding a complex set of Dfa mRNAs that are present largely, although not exclusively, in the testis. A specific Dfa mRNA encodes, via its 3'-terminal exon, a 217-residue protein termed Dfa(A). Other Dfa mRNAs also contain this exon. Dfa(A) is sequelogous (similar in sequence) to a region of the human/mouse HTEX4 protein, whose physiological function is unknown. We produced an affinity-purified antibody to recombinant mouse Dfa(A) that detected a 35-kDa protein in the mouse testis and in several cell lines. Experiments in which RNA interference was used to down-regulate Dfa indicated that the 35-kDa protein was indeed Dfa(A). Furthermore, Dfa(A) was present in the interchromatin granule clusters and was also found to bind to the Ggnbp1 gametogenetin-binding protein-1 and to the Abt1 activator of basal transcription that interacts with the TATA-binding protein. Given these results, RNA interference was used to probe the influence of Dfa levels in luciferase reporter assays. We found that Dfa(A) acts as a repressor of TATA-box transcriptional promoters.


Figures

FIGURE 1.
FIGURE 1.
Genomic characterization of the mouse Dfa gene. A, bidirectional promoter upstream of the mouse Ate1 exon 1B (see Introduction and Refs. 12, 14). Green arrows indicate transcriptional units oriented in both directions from the PAte1/Dfa promoter and also from an unmapped “upstream” promoter that mediates the expression of Ate1 transcripts containing exon 1A (14). The locations and sizes of some Ate1 exons are shown as well. B, to make expression patterns of Dfa easier to follow, the orientation of the Dfa and Ate1 transcriptional units was flipped 180° in this and other panels, in comparison with A. Percent identity (from 50 to 100%) of each gap-free segment between ∼14 kb of the mouse and human genomic DNA segments that encompass the Ate1 and Dfa genes. Position of identities are shown with respect to mouse DNA. Note short regions of significant conservation, including an ∼200-bp segment that contains the bidirectional PAte1/Dfa promoter. C, (G + C) content (%) over ∼14 kb of genomic DNA that encompasses the 5′-regions of Dfa and Ate1 reveals a CpG island at the center of the bidirectional PAte1/Dfa promoter (see the main text). D, shown are the relative positions of Ate1 exons 1A, 1B, and 2, the bidirectional PAte1/Dfa promoter, and Dfa exons 1–7. The two oppositely oriented arrows at the PAte1/Dfa promoter indicate the directions of Ate1 and Dfa transcription, respectively. E, different species of RT-PCR DNA fragments that were amplified from mouse testis total RNA in this work and their positions vis à vis specific Dfa exons that are shown in D. A yellow box exon 7 (Dfa cDNAs I, II, and V) signifies the use of splice junction 1 to produce a Dfa transcript (see panel I). A blue box exon 7 (Dfa cDNAs III, IV, and VI) signifies the use of splice junction 2 (see panel I) to produce a Dfa transcript. F, comparison and classification of ESTs in the NCBI data base that encompassed the Ate1/Dfa locus. These ESTs are arranged according to their positions vis à vis specific Ate1 or Dfa exons (see D) and specific RT-PCR DNA fragments isolated in this study (see E). G, Northern analyses of Dfa expression in mouse tissues. Upper panel, Dfa exon 3-specific probe. Middle panel, Dfa exon 7-specific probe. Lower panel, β-actin mRNA probe was used to verify the uniformity of total RNA inputs. H, RT-PCR DNA fragments amplified from total RNA isolated from indicated mouse tissues. Upper panel, ∼0.7-kb Dfa-specific RT-PCR DNA fragment amplified from testis RNA using forward and reverse primers annealing to the class IV EST-CA465465 (see F) (forward 5′-CCAGACCACAGAGCCAGCAC-3′; reverse 5′-TTTGCCCAGGCCATTTTCGGC-3′). DNA sequence analyses of RT-PCR-amplified DNA fragments from tissues other than the testis indicated that they were nonspecific (unrelated to the Dfa/Ate1 locus) (data not shown). Middle panel, ∼1.7 and ∼0.8 kb Dfa-specific RT-PCR DNA fragments amplified from testis RNA using a forward primer annealing genomic DNA in the vicinity of the bidirectional PAte1/Dfa promoter (5′-GCCCTTGTATTCCACCACCG-3′) and a reverse primer annealing to the class IV EST-CA465465 (reverse 5′-TTTGCCCAGGCCATTTTCGGC-3′). Bottom panel, β-actin-specific RT-PCR DNA fragments derived from all tissues (mix, equimolar mixture of cDNA isolated from brain, kidney, liver, lung, spleen, and testis; ±RT, indicates the presence or absence of reverse transcriptase used in generating 1st strand cDNA). I, diagram of the Dfa pre-mRNA splicing that involved depicting the alternative splice site selection between Dfa exons 6 and 7. See E and the main text for additional details.
FIGURE 2.
FIGURE 2.
Amino acid sequence of Dfa. A, deduced mouse Dfa amino acid sequence encoded by Dfa cDNA-II (see Fig. 1E). This sequence includes the 217-residue sequence (in black letters) that is encoded by exon 7 and includes the DfaA isoform (see the main text). DfaB, a larger isoform shown here, differs from DfaA in containing an N-terminal extension (in red letters) that is encoded by exons 5 and 6 and is produced by selection of the splice junction 1 in Dfa cDNA-II (Fig. 1, E and I). Exon junctions, including alternative junctions at nucleotide positions 661 and 668, are indicated by vertical bars. The corresponding Dfa exons (see Fig. 1, D and E) are indicated on the right. The deduced N-terminal Met residue of the DfaA isoform is circled. Dfa-coding sequences that were targeted by RNAi (shRNA) in the present study are boxed and are denoted on the left. Underlined nucleotides denote the deduced poly(A) signal. Nucleotide 1 is the 5′-end of Dfa cDNA-II mapped by RACE (see under “Experimental Procedures”). B, ClustalW2-based amino acid sequence alignments of mouse and rat Dfa versus human and mouse Htex4 (see the main text). Note that the sequences encoded by Dfa exons 6 and 7 are sequelogous (18) to Htex4. Residues of similar physicochemical properties are similarly colored. Specifically, A, V, F, P, M, I, L, and W are shown in red; D and E are shown in blue; R, H, and K are shown in magenta, and S, T, Y, H, C, N, G, and Q are shown in green. *, identical residues in all of the aligned sequences; :, highly conserved; ., weakly conserved.
FIGURE 3.
FIGURE 3.
Characterization of mouse Dfa. A, endogenous Dfa detected by SDS-PAGE and immunoblotting (IB), with affinity-purified anti-Dfaex7 antibody (see “Experimental Procedures”) of extracts from mouse testis, hippocampus (hc), cerebellum (cb), total brain (brain), heart, spleen, liver, and kidney. Lower panel, immunoblotting of the same extracts using an anti-tubulin antibody. Arrow on the left indicates a major ∼35-kDa Dfa species in the testis. B, endogenous 35-kDa Dfa detected using anti-Dfaex7 and immunoblotting of extracts from mouse NIH-3T3 cells and human HeLa and HEK-293T cells. C, 35-kDa Dfa, detected by immunoblotting with anti-Dfaex7, in serially diluted extracts from NIH-3T3 cells. Lanes 1–3, 20, 4, and 0.4 μg of total protein, respectively. D, relative levels of the 35-kDa Dfa (detected with anti-Dfaex7, upper panel) and Ate1 (detected with anti-Ate1; lower panel) in specific fractions of a mouse testis extract. WCE, whole-cell extract; cyto, cytosolic fraction; post-lys super, post-lysosomal supernatant (28,000 × g for 90 min); post-nuclear super, post-nuclear supernatant (16,000 × g for 90 min). E, immunoblotting, using anti-Dfaex7, of fractions collected from a Superdex-200 column fractions 4–30. Upper panel, cytosolic subfraction of mouse testis extract. Middle panel, same but a nuclear extract. Lower panel, gel filtration pattern, on the same column, of the recombinant mouse DfaA that had been purified from S. cerevisiae (see “Experimental Procedures”). F–K, Subcellular localization of eGFP-DfaA transiently expressed in NIH-3T3 cells. F and G, fluorescent and phase contrast images, respectively, of cells that had been transiently transfected with the control plasmid pEGFP-C1, expressing eGFP. H and I, same but cells were transfected with pEGFP-DfaA, which expressed eGFP-DfaA. Note the predominantly nuclear localization of eGFP-DfaA. J and K, same but with cells (also transfected with pEGFP-DfaA) in which eGFP-DfaA was apparently associated plasma membranes (<10% of transfected cells). L–P, subnuclear localization of eGFP-DfaA transiently expressed in NIH-3T3 cells. L, fluorescent image showing large and “condensed” nuclear speckles in cells expressing eGFP-DfaA (white arrow). M, 4′,6-diamidino-2-phenylindole staining of the same field as in L reveals four additional non-transfected cells. N, merged image of L and M (4′,6-diamidino-2-phenylindole and EGFP). O, immunofluorescent image, produced using an anti-SC35 antibody (see the main text) and showing condensed nuclear speckles in the nucleus of a cell that expressed eGFP-DfaA (see L). P, merged image of L and O, suggesting colocalization of SC-35 and eGFP-DfaA in the nuclear IGC (see the main text). Q, higher magnification of three large, condensed EGFP-DfaA-containing nuclear speckles, one of them with visible “cavities,” in a single nucleus (see also the main text). Bars in F, L, and Q indicate 10 μm.
FIGURE 4.
FIGURE 4.
RNAi of Dfa. A, relative efficacies of different shRNAs in down-regulating the expression of exogenous (triple-FLAG-tagged) f3DfaA in NIH-3T3 cells, measured using immunoblotting with anti-FLAG antibody. Lane 1, pEN, the parental pEN_hU6miR2c vector for shRNAs. Lane 2, shRNA specific for phospholipase Cγ (PLCγ). Lanes 3–6, DFAsh1, DFAsh2, DFAsh4, and DFAsh5, specific for different regions of Dfa mRNAs (see Fig. 2A). Lane 7, control 3T3 cells, mock-transfected. B, same as in A but with f3DfaB. Equal numbers of cells were transfected with equal amounts of a Dfa-expressing plasmid, an shRNA-expressing plasmid, or control vectors. C, effect of increasing amounts of transfected DFAsh5 on the levels of exogenous f3DfaA. Lane 1, transfected with a vector alone. Lane 2, transfected with 1 μg of pcDNA-FLAG-DfaA (pCB180), expressing f3DfaA. Lane 3, same as lane 2 but cells were also cotransfected also with 1 μg of pEN-DFAsh5, expressing DFAsh5 shRNA. Lane 4, same as lane 3 but 2 μg of pEN-DFAsh5. Total amounts of DNA in each transfection were equalized using an empty DNA vector. D, same as in C but with DFAsh4 shRNA. Asterisks in A– D denote a protein cross-reacting with anti-FLAG antibody. E, comparing, using anti-Dfaex7 immunoblots, the levels of endogenous DfaA in independently produced NIH-3T3 cell clones, either a control cell line or stably transfected with pEN-DFAsh4 DfaA (two representative examples, out of a number of cell clones thus produced, are shown). Upper panel, quantitation of the levels of endogenous DfaA that was detected by immunoblotting with anti-DfaA (middle panel). Lower panel, relative levels of the Ate1 R-transferase in the same cell clones, determined by immunoblotting with anti-Ate1 antibody. Lane 1, NIH-3T3 cells stably transfected with a vector alone. Lanes 2 and 3, same but with a plasmid expressing DFAsh4 shRNA (30 and 13% of control DfaA levels, respectively, in different 3T3 clones).
FIGURE 5.
FIGURE 5.
Two-hybrid assay detects interaction of DfaA with Ggnbp1. A, diagram of different segments of the mouse GgnBP1 protein that were isolated in 16 independent “two-hybrid-positive” clones from 32 separate S. cerevisiae colonies. The number of times each segment GgnBP1 was isolated in two-hybrid assays is shown in parentheses to the right. The DUF1055 domain of GgnBP1 (between residues 300 and 358) is shaded. B, soluble (upper two panels) and insoluble (solubilized by guanidine-HCl) proteins from BL21 (DE3) E. coli cells that had been transformed with pET-Duet1 plasmids (see “Experimental Procedures”). Lane 1, E. coli expressing mouse His6-DfaA. Lane 2, E. coli expressing N-terminally HA-tagged mouse haGgnBP1. Lane 3, E. coli expressing both His6-DfaA and haGgnBP1. Note a decrease in the fraction of soluble His6-DfaA in the presence of coexpressed (and virtually entirely insoluble) haGgnBP1 (cf. lanes 1 and 3). C, indicated DBD fusion and activation domain (AD) fusion proteins were expressed in S. cerevisiae YH109 and assayed for their ability to grow on SD medium lacking either Leu and Trp or lacking Leu, Trp, His, and Ade (QDO (Quadruple DropOut) media; see the main text and see under “Experimental Procedures”).
FIGURE 6.
FIGURE 6.
DfaA interacts with Abt1 and inhibits transcription from the TATA-containing PCMV promoter. A, indicated Abt1-based and Dfa-based DBD fusion and activation domain (AD) fusion proteins were expressed in S. cerevisiae YH109, and two-hybrid assays for their interaction were carried out (see under “Experimental Procedures”). QDO, quadruple dropout. B, mouse NIH-3T3 cells were transiently transfected with pcDNA-based plasmids that expressed the indicated proteins (tagged with the FLAG or HA epitopes), followed by preparation of extracts, and either SDS-PAGE (followed by immunoblotting with anti-FLAG and anti-HA) or immunoprecipitation with anti-FLAG antibody, followed by SDS-PAGE of immunoprecipitates and immunoblotting with anti-HA antibody. IB, immunoblotting; IP, immunoprecipitation. C, levels of luciferase (expressed from the PAte1/Dfa promoter in the plasmid pCB44 (14)) in extracts from mouse NIH-3T3 cells that had been cotransfected with pCB44 and the indicated plasmids (the empty vector pCDNA; the f3DfaA-expressing pCB180, and the DFAsh4 shRNA-expressing pEN-DFAsh4). Luciferase levels are plotted as percentages of the level that was observed with pcDNA3.1 vector alone (no exogenous DfaA; no DFAsh4 shRNA). Error bars indicate standard deviations among three independent assays. D, same as in C but with luciferase expressed from the TATA-box-containing PCMV promoter. The immunoblot in D shows relative levels of f3DfaA in the corresponding cotransfected cells. An asterisk denotes a protein cross-reacting with anti-FLAG antibody.

Similar articles

Cited by

References

    1. Varshavsky A. (1996) Proc. Natl. Acad. Sci. U.S.A. 93, 12142–12149 - PMC - PubMed
    1. Mogk A., Schmidt R., Bukau B. (2007) Trends Cell Biol. 17, 165–172 - PubMed
    1. Tasaki T., Kwon Y. T. (2007) Trends Biochem. Sci. 32, 520–528 - PubMed
    1. Varshavsky A. (2008) Nat. Struct. Mol. Biol. 15, 1238–1240 - PubMed
    1. Varshavsky A. (2008) J. Biol. Chem. 283, 34469–34489 - PMC - PubMed

Publication types