

Stance and swing phase costs in human walking
- PMID: 20356877
- PMCID: PMC2894890
- DOI: 10.1098/rsif.2010.0084
Stance and swing phase costs in human walking
Abstract
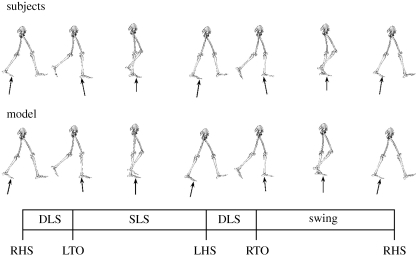
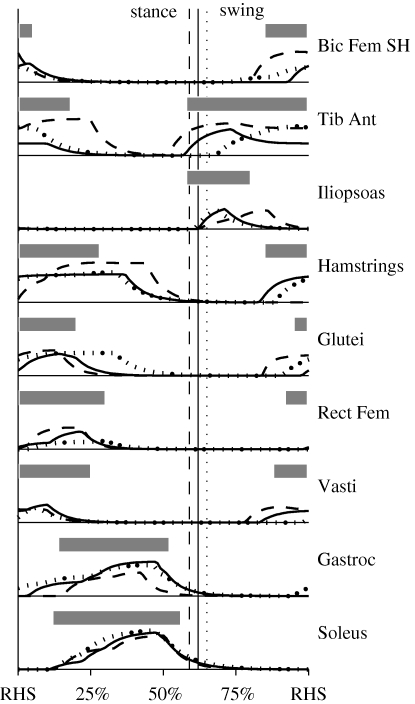
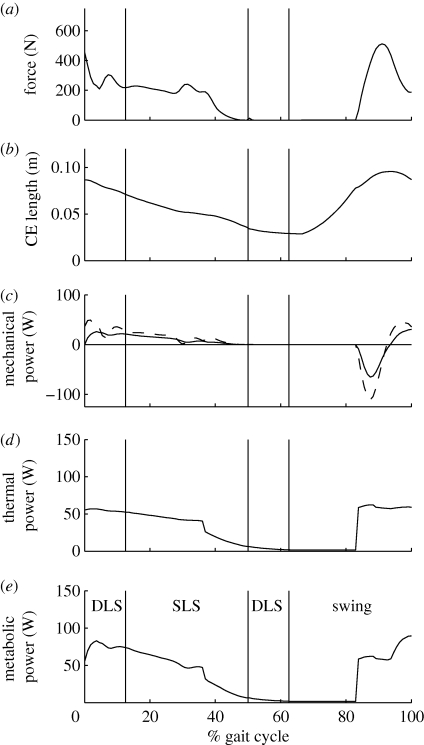
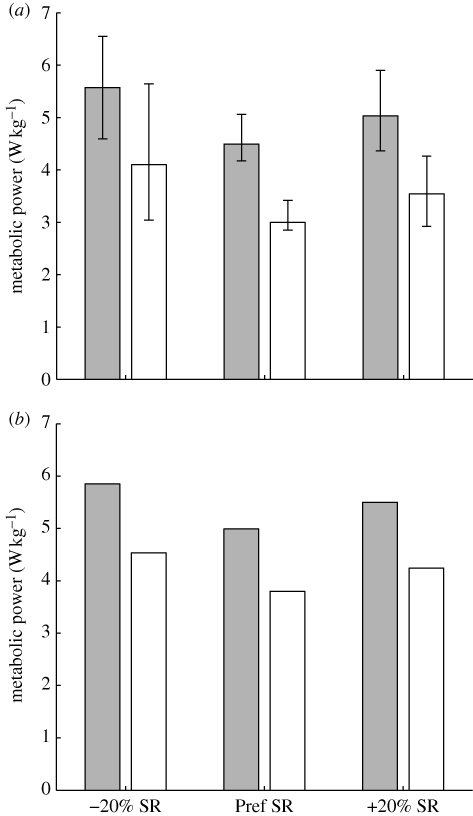
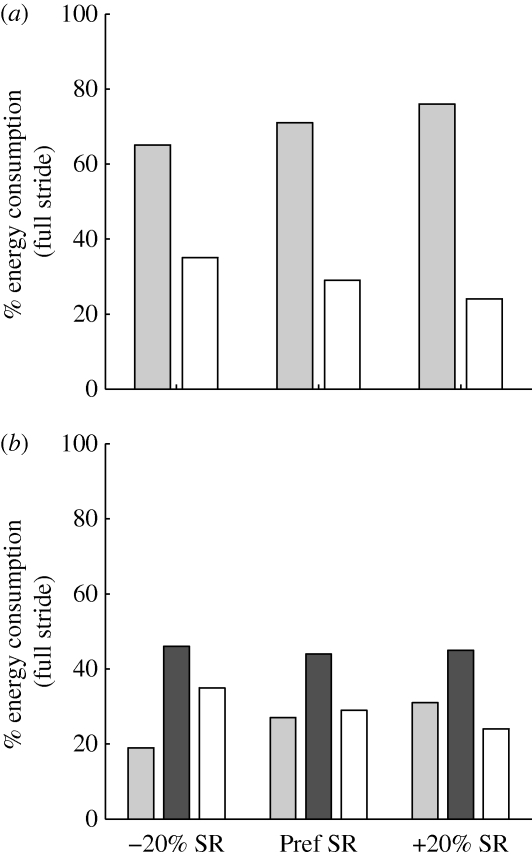
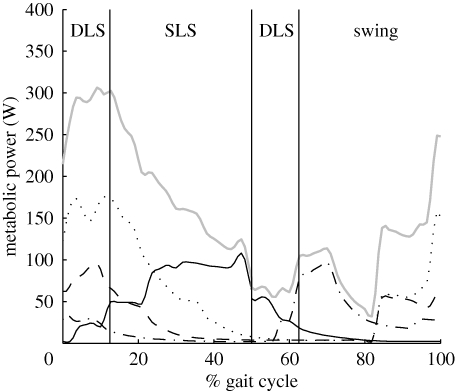
Leg swing in human walking has historically been viewed as a passive motion with little metabolic cost. Recent estimates of leg swing costs are equivocal, covering a range from 10 to 33 per cent of the net cost of walking. There has also been a debate as to whether the periods of double-limb support during the stance phase dominate the cost of walking. Part of this uncertainty is because of our inability to measure metabolic energy consumption in individual muscles during locomotion. Therefore, the purpose of this study was to investigate the metabolic cost of walking using a modelling approach that allowed instantaneous energy consumption rates in individual muscles to be estimated over the full gait cycle. At a typical walking speed and stride rate, leg swing represented 29 per cent of the total muscular cost. During the stance phase, the double-limb and single-limb support periods accounted for 27 and 44 per cent of the total cost, respectively. Performing step-to-step transitions, which encompasses more than just the double-support periods, represented 37 per cent of the total cost of walking. Increasing stride rate at a constant speed led to greater double-limb support costs, lower swing phase costs and no change in single-limb support costs. Together, these results provide unique insight as to how metabolic energy is expended over the human gait cycle.
Figures
Similar articles
-
Contributions of the individual ankle plantar flexors to support, forward progression and swing initiation during walking.J Biomech. 2001 Nov;34(11):1387-98. doi: 10.1016/s0021-9290(01)00105-1. J Biomech. 2001. PMID: 11672713
-
Contributions to the understanding of gait control.Dan Med J. 2014 Apr;61(4):B4823. Dan Med J. 2014. PMID: 24814597 Review.
-
The energetic costs of trunk and distal-limb loading during walking and running in guinea fowl Numida meleagris: I. Organismal metabolism and biomechanics.J Exp Biol. 2006 Jun;209(Pt 11):2050-63. doi: 10.1242/jeb.02226. J Exp Biol. 2006. PMID: 16709908
-
Reconstruction of human swing leg motion with passive biarticular muscle models.Hum Mov Sci. 2017 Apr;52:96-107. doi: 10.1016/j.humov.2017.01.008. Epub 2017 Feb 7. Hum Mov Sci. 2017. PMID: 28182970
-
Dynamic principles of gait and their clinical implications.Phys Ther. 2010 Feb;90(2):157-74. doi: 10.2522/ptj.20090125. Epub 2009 Dec 18. Phys Ther. 2010. PMID: 20023002 Free PMC article. Review.
Cited by
-
Humans, geometric similarity and the Froude number: is ''reasonably close'' really close enough?Biol Open. 2013 Feb 15;2(2):111-20. doi: 10.1242/bio.20122691. Epub 2012 Nov 20. Biol Open. 2013. PMID: 23431123 Free PMC article.
-
Optimization of prosthetic foot stiffness to reduce metabolic cost and intact knee loading during below-knee amputee walking: a theoretical study.J Biomech Eng. 2012 Nov;134(11):111005. doi: 10.1115/1.4007824. J Biomech Eng. 2012. PMID: 23387787 Free PMC article.
-
Connecting the legs with a spring improves human running economy.J Exp Biol. 2019 Sep 3;222(Pt 17):jeb202895. doi: 10.1242/jeb.202895. J Exp Biol. 2019. PMID: 31395676 Free PMC article.
-
Human Motion Recognition of Knitted Flexible Sensor in Walking Cycle.Sensors (Basel). 2019 Dec 19;20(1):35. doi: 10.3390/s20010035. Sensors (Basel). 2019. PMID: 31861614 Free PMC article.
-
Rapid predictive simulations with complex musculoskeletal models suggest that diverse healthy and pathological human gaits can emerge from similar control strategies.J R Soc Interface. 2019 Aug 30;16(157):20190402. doi: 10.1098/rsif.2019.0402. Epub 2019 Aug 21. J R Soc Interface. 2019. PMID: 31431186 Free PMC article.
References
MeSH terms
LinkOut - more resources
Full Text Sources
Medical
