. 2010 Jun;298(6):R1531-42.
doi: 10.1152/ajpregu.00849.2009. Epub 2010 Mar 31.

CLIC5 mutant mice are resistant to diet-induced obesity and exhibit gastric hemorrhaging and increased susceptibility to torpor

Affiliations

CLIC5 mutant mice are resistant to diet-induced obesity and exhibit gastric hemorrhaging and increased susceptibility to torpor

Emily M Bradford et al. Am J Physiol Regul Integr Comp Physiol. 2010 Jun.

Abstract

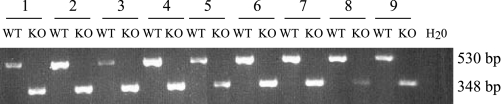
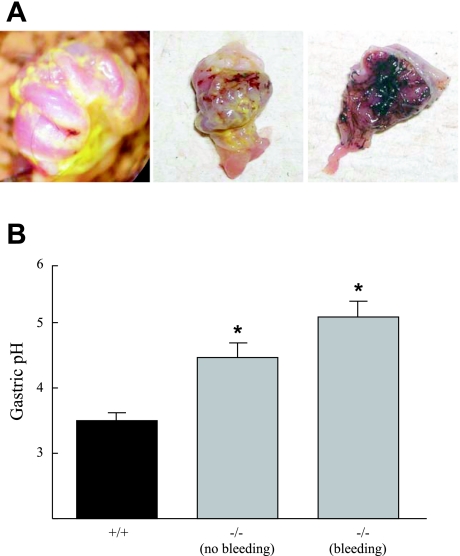
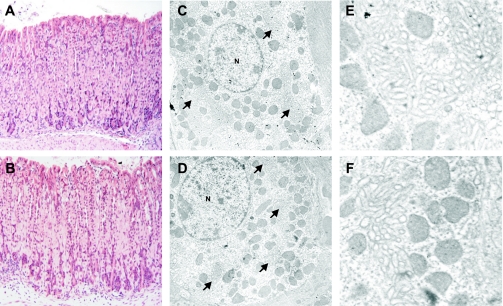
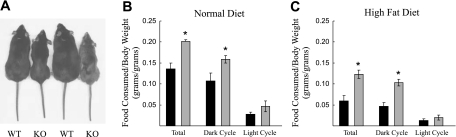
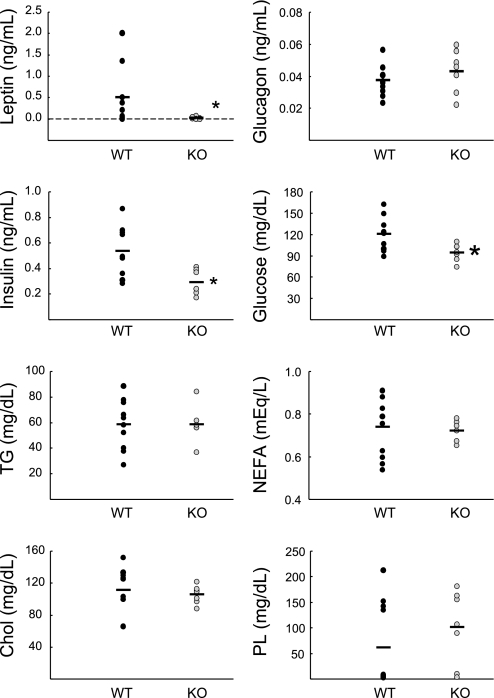
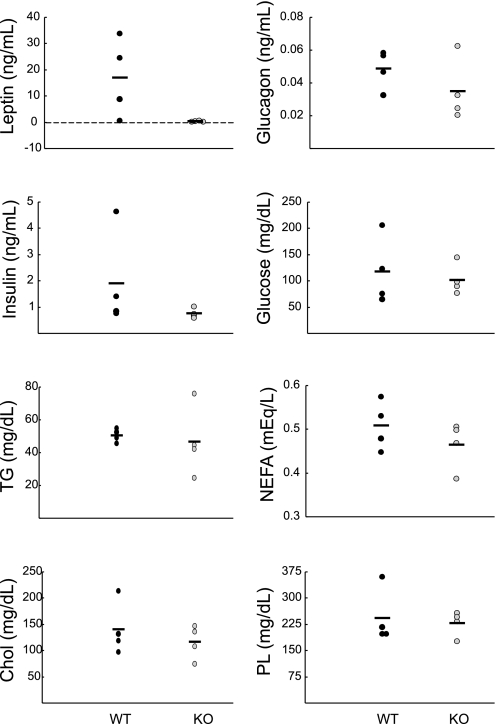
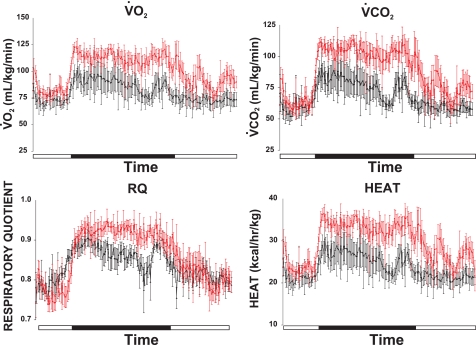
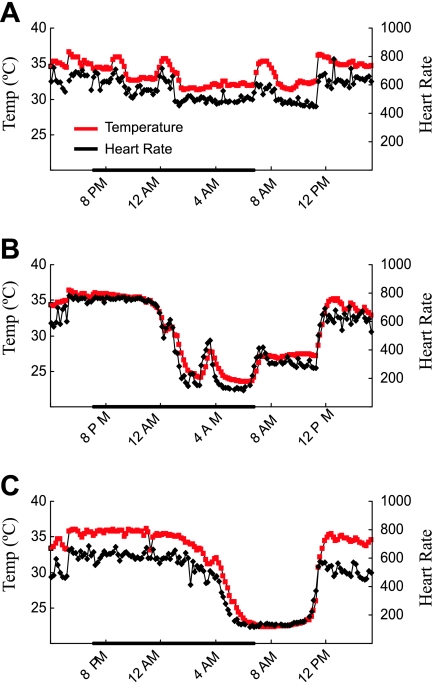
Chloride intracellular channel 5 (CLIC5) and other CLIC isoforms have been implicated in a number of biological processes, but their specific functions are poorly understood. The association of CLIC5 with ezrin and the actin cytoskeleton led us to test its possible involvement in gastric acid secretion. Clic5 mutant mice exhibited only a minor reduction in acid secretion, Clic5 mRNA was expressed at only low levels in stomach, and Clic5 mutant parietal cells were ultrastructurally normal, negating the hypothesis that CLIC5 plays a major role in acid secretion. However, the mutants exhibited gastric hemorrhaging in response to fasting, reduced monocytes and granulocytes suggestive of immune dysfunction, behavioral and social disorders suggestive of neurological dysfunction, and evidence of a previously unidentified metabolic defect. Wild-type and mutant mice were maintained on normal and high-fat diets; plasma levels of various hormones, glucose, and lipids were determined; and body composition was studied by quantitative magnetic resonance imaging. Clic5 mutants were lean, hyperphagic, and highly resistant to diet-induced obesity. Plasma insulin and glucose levels were reduced, and leptin levels were very low; however, plasma triglycerides, cholesterol, phospholipids, and fatty acids were normal. Indirect calorimetry revealed increased peripheral metabolism and greater reliance on carbohydrate metabolism. Because Clic5 mutants were unable to maintain energy reserves, they also exhibited increased susceptibility to fasting-induced torpor, as indicated by telemetric measurements showing episodes of reduced body temperature and heart rate. These data reveal a requirement for CLIC5 in the maintenance of normal systemic energy metabolism.


Figures

Fig. 1.
Fig. 1.
PCR analysis of the tissue distribution of Clic5 mRNA in wild-type (WT) and Clic5 mutant (KO) mice. Total RNA was extracted from tissues of WT and KO mice and reverse transcribed, and the resulting cDNA was amplified as described in materials and methods to yield 530- and 348-bp products for WT and KO alleles, respectively. The following tissues were analyzed: 1, duodenum; 2, jejunum; 3, ileum; 4, colon; 5, stomach; 6, heart; 7, kidney; 8, liver; 9, brain.
Fig. 2.
Fig. 2.
Gastric hemorrhaging and mild hypochlorhydria in KO mice. A: everted stomachs of KO mice subjected to overnight fasting reveal hemorrhaging of the glandular stomach with varying levels of severity, from focal bleeding (left), mild but more diffuse bleeding (center), to severe hemorrhaging (right). B: measurements of gastric pH after overnight fasting and stimulation with histamine revealed mild hypochlorhydria in KO (−/−) mice relative to WT (+/+) mice. KO mice were separated based on the presence of blood on the lumenal surface of the stomach (bleeding) or the absence of any detectable hemorrhaging (no bleeding). For mice with no signs of hemorrhage: n = 5 (WT) and 8 (KO) mice; for mice in which bleeding was detected: n = 4. *P < 0.05 compared with WT based on a Student's t-test.
Fig. 3.
Fig. 3.
Morphology of gastric glands and parietal cells in WT and KO mice. Hematoxylin and eosin staining shows normal structure of the gastric glands in stomachs of WT (A) and KO mice (B). Electron microscopy revealed normal tubulovesicles, canalicular membranes (arrows), mitochondria, and nuclei (N) in parietal cells from WT (C and E) and KO (D and F) mice. E (WT) and F (KO): increased magnification of normal canalicular membranes.
Fig. 4.
Fig. 4.
KO mice are smaller than their WT littermates and are hyperphagic. A: at 8 mo of age, female KO mice were significantly leaner than their WT littermates. B: when normalized to body weight (g food consumed/g body wt), adult KO mice (grey bars) consumed more food over 24 h than WT mice (black bars), which was largely due to increased food consumption during the dark cycle (7 PM to 7 AM); n = 5 male and n = 2 female littermate pairs. C: after 2 wk on the high-fat diet, adult male mutant mice (grey bars, n = 4) continued to consume more food than male WT mice (black bars, n = 4). *P < 0.05 using a Student's t-test.
Fig. 5.
Fig. 5.
Morphology of the liver in WT and KO mice. Hematoxylin and eosin staining shows normal liver morphology in adult WT (A) and KO (B) mice that were maintained on a normal diet. However, after 4 mo on a high-fat diet, sections from WT mice (C) clearly showed the presence of lipid in hepatocytes (black arrows), while lipid accumulation appeared to be significantly reduced in the liver from KO mice (D). In panels A–D the white space surrounding the hematoxylin-stained nuclei indicates where lipid was localized prior to dehydration of the sections. E: toluidine blue staining of plastic sections revealed large, well-formed lipid droplets (black arrows) in hepatocytes from WT mice maintained on a high-fat diet. F: in contrast, very few, and much smaller, lipid droplets (black arrow) were visible in liver sections from KO mice maintained on a high-fat diet. Foci of hematopoiesis (white arrow) were visible in some liver sections from KO mice maintained on a high-fat diet, although they were never detected in liver sections from WT mice.
Fig. 6.
Fig. 6.
Plasma profile of nonfasted WT and KO mice. Plasma hormones and lipids from male WT and heterozygous mice (black circles, n = 7 WT and 4 heterozyotes) and KO mice (grey circles, n = 7) were measured without fasting. Values for WT and heterozygous mice were not significantly different, so they were pooled. Leptin levels were severely reduced in the mutant mice (0.04 ± 0.02 ng/ml), and 2 of the 7 KO mice had no detectible levels of leptin. Plasma triglycerides (TG), nonesterified fatty acids (NEFA), total cholesterol (Chol), and phospholipids (PL) were normal in the KO mice. *P < 0.05 using a Mann-Whitney rank sum test.
Fig. 7.
Fig. 7.
Plasma profile of fasted WT and KO mice. Plasma hormones and lipids from male WT (black circles, n = 5) and male KO mice (grey circles, n = 5) were measured after 5 h of fasting. In KO mice, leptin levels were 0.14 ± 0.14 ng/ml, with 3 of the 5 KO mice having undetectable levels of leptin. TG, NEFA, Chol, and PL were normal in mutant mice. *P < 0.05 using a Mann-Whitney rank sum test.
Fig. 8.
Fig. 8.
Plasma profile of WT and KO mice on a high-fat diet. Plasma hormone and lipid levels from unfasted female WT (black circles, n = 4) and KO mice (grey circles, n = 4) that had been on a high-fat diet for 4 mo were measured. Due to the high variability, neither the differences in leptin nor insulin levels achieved statistical significance. Levels of TG, NEFA, Chol, and PL were normal in mutant mice.
Fig. 9.
Fig. 9.
Indirect calorimetry of WT and KO mice. Measurements of O2 consumption (V̇o2), CO2 production (V̇co2), the respiratory quotient (RQ), and heat production were measured over 24 h as described in materials and methods. Black bars indicate the dark cycle (7 PM-7 AM). The groups included mice of both sexes, ranging from 3 to 6 mo old, and individual pairs were sex-matched littermates (n = 5 male and n = 2 female mice of each genotype).
Fig. 10.
Fig. 10.
. KO mice are more susceptible to fasting-induced torpor than WT mice. Because fasting Clic5−/− mice were frequently observed to enter torpor, mice were implanted with radiotelemeters to measure core body temperature (red line) and heart rate (black line) to further analyze susceptibility to fasting-induced torpor. The graphs show one 24-h period (from 4 PM to 4 PM); mice were fasted from 6 PM to 11 AM, and the dark bar indicates the dark cycle (7 PM to 7 AM). A representative tracing is shown for a WT male mouse (A) and a female littermate (B). During torpor, the WT mouse reduced its temperature to 31.2°C and its heart rate to 448 beats/min, while the mutant mouse reduced its body temperature to 23.5°C and 117 beats/min. Note the simultaneous fluctuation of body temperature and heart rate. Although it is normal for mice to rouse from torpor periodically during the dark cycle, some mutant mice did not. C: tracing of a female KO mouse undergoing a sustained bout of torpor, with body temperature reduced to 22.3°C and heart rate to 112 beats/min.

References

    1. Ashley RH. Challenging accepted ion channel biology: p64 and the CLIC family of putative intracellular anion channel proteins. Mol Membr Biol 20: 1–11, 2003 - PubMed
    1. Bennett BD, Solar GP, Yuan JQ, Mathias J, Thomas GR, Matthews W. A role for leptin and its cognate receptor in hematopoiesis. Curr Biol 6: 1170–1180, 1996 - PubMed
    1. Berry KL, Bulow HE, Hall DH, Hobert OA. C. elegans CLIC-like protein required for intracellular tube formation and maintenance. Science 302: 2134–2137, 2003 - PubMed
    1. Berryman M, Bretscher A. Identification of a novel member of the chloride intracellular channel gene family (CLIC5) that associates with the actin cytoskeleton of placental microvilli. Mol Biol Cell 11: 1509–1521, 2000 - PMC - PubMed
    1. Berryman M, Bruno J, Price J, Edwards JC. CLIC-5A functions as a chloride channel in vitro and associates with the cortical actin cytoskeleton in vitro and in vivo. J Biol Chem 279: 34794–34801, 2004 - PubMed

Publication types