

Pronounced inter- and intrachromosomal variation in linkage disequilibrium across the zebra finch genome
- PMID: 20357051
- PMCID: PMC2847752
- DOI: 10.1101/gr.102095.109
Pronounced inter- and intrachromosomal variation in linkage disequilibrium across the zebra finch genome
Abstract
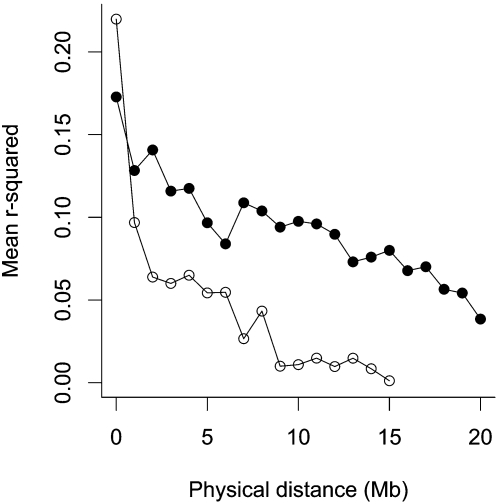
The extent of nonrandom association of alleles at two or more loci, termed linkage disequilibrium (LD), can reveal much about population demography, selection, and recombination rate, and is a key consideration when designing association mapping studies. Here, we describe a genome-wide analysis of LD in the zebra finch (Taeniopygia guttata) using 838 single nucleotide polymorphisms and present LD maps for all assembled chromosomes. We found that LD declined with physical distance approximately five times faster on the microchromosomes compared to macrochromosomes. The distribution of LD across individual macrochromosomes also varied in a distinct pattern. In the center of the macrochromosomes there were large blocks of markers, sometimes spanning tens of mega bases, in strong LD whereas on the ends of macrochromosomes LD declined more rapidly. Regions of high LD were not simply the result of suppressed recombination around the centromere and this pattern has not been observed previously in other taxa. We also found evidence that this pattern of LD has remained stable across many generations. The variability in LD between and within chromosomes has important implications for genome wide association studies in birds and for our understanding of the distribution of recombination events and the processes that govern them.
Figures


Similar articles
-
The recombination landscape of the zebra finch Taeniopygia guttata genome.Genome Res. 2010 Apr;20(4):485-95. doi: 10.1101/gr.101410.109. Epub 2010 Mar 31. Genome Res. 2010. PMID: 20357052 Free PMC article.
-
A linkage map of the zebra finch Taeniopygia guttata provides new insights into avian genome evolution.Genetics. 2008 May;179(1):651-67. doi: 10.1534/genetics.107.086264. Genetics. 2008. PMID: 18493078 Free PMC article.
-
Comparison of linkage disequilibrium and haplotype diversity on macro- and microchromosomes in chicken.BMC Genet. 2009 Dec 20;10:86. doi: 10.1186/1471-2156-10-86. BMC Genet. 2009. PMID: 20021697 Free PMC article.
-
Contrasting methods of quantifying fine structure of human recombination.Annu Rev Genomics Hum Genet. 2010;11:45-64. doi: 10.1146/annurev-genom-082908-150031. Annu Rev Genomics Hum Genet. 2010. PMID: 20690817 Free PMC article. Review.
-
On selecting markers for association studies: patterns of linkage disequilibrium between two and three diallelic loci.Genet Epidemiol. 2003 Jan;24(1):57-67. doi: 10.1002/gepi.10217. Genet Epidemiol. 2003. PMID: 12508256 Review.
Cited by
-
The singing genome.Heredity (Edinb). 2011 Apr;106(4):533-4. doi: 10.1038/hdy.2010.109. Epub 2010 Sep 8. Heredity (Edinb). 2011. PMID: 20823906 Free PMC article. No abstract available.
-
Linkage disequilibrium and past effective population size in native Tunisian cattle.Genet Mol Biol. 2019 Jan-Mar;42(1):52-61. doi: 10.1590/1678-4685-GMB-2017-0342. Epub 2019 Feb 18. Genet Mol Biol. 2019. PMID: 30776288 Free PMC article.
-
Replicated high-density genetic maps of two great tit populations reveal fine-scale genomic departures from sex-equal recombination rates.Heredity (Edinb). 2014 Mar;112(3):307-16. doi: 10.1038/hdy.2013.107. Epub 2013 Oct 23. Heredity (Edinb). 2014. PMID: 24149651 Free PMC article.
-
Low recombination rates in sexual species and sex-asex transitions.Philos Trans R Soc Lond B Biol Sci. 2017 Dec 19;372(1736):20160461. doi: 10.1098/rstb.2016.0461. Philos Trans R Soc Lond B Biol Sci. 2017. PMID: 29109224 Free PMC article.
-
The genome of a globally invasive passerine, the common myna, Acridotheres tristis.DNA Res. 2024 Jan 1;31(2):dsae005. doi: 10.1093/dnares/dsae005. DNA Res. 2024. PMID: 38366840 Free PMC article.
References
-
- Abasht B, Sandford E, Arango J, Settar P, Fulton J, O'Sullivan N, Hassen A, Habier D, Fernando R, Dekkers J, et al. Extent and consistency of linkage disequilibrium and identification of DNA markers for production and egg quality traits in commercial layer chicken populations. BMC Genomics. 2009;10:S2. doi: 10.1186/1471-2164-10-S2-S2. - DOI - PMC - PubMed
-
- Abecasis GR, Cookson WO. GOLD—graphical overview of linkage disequilibrium. Bioinformatics. 2000;16:182–183. - PubMed
-
- Aerts J, Megens HJ, Veenendaal T, Ovcharenko I, Crooijmans R, Gordon L, Stubbs L, Groenen M. Extent of linkage disequilibrium in chicken. Cytogenet Genome Res. 2007;117:338–345. - PubMed
-
- Ardlie KG, Kruglyak L, Seielstad M. Patterns of linkage disequilibrium in the human genome. Nat Rev Genet. 2002;3:299–309. - PubMed
Publication types
MeSH terms
Grants and funding
LinkOut - more resources
Full Text Sources
Research Materials