Comparative Study
. 2010 Apr;20(4):485-95.
doi: 10.1101/gr.101410.109. Epub 2010 Mar 31.

The recombination landscape of the zebra finch Taeniopygia guttata genome

Affiliations
Comparative Study

The recombination landscape of the zebra finch Taeniopygia guttata genome

Niclas Backström et al. Genome Res. 2010 Apr.

Abstract

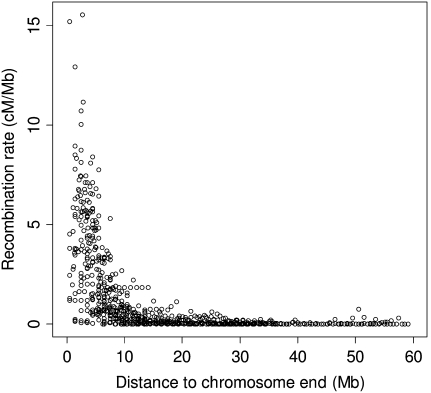
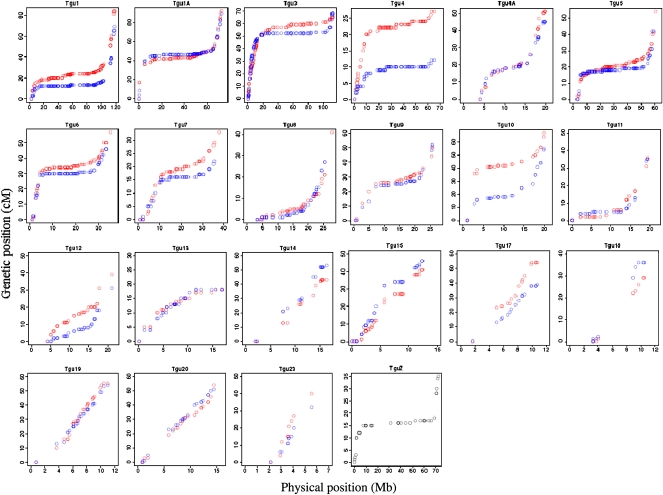
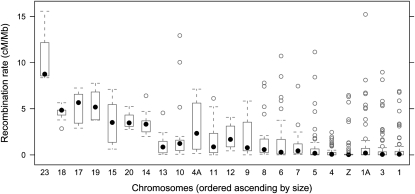
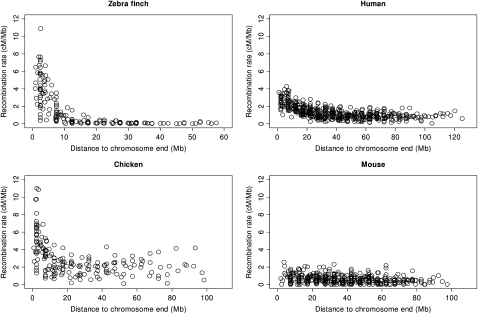
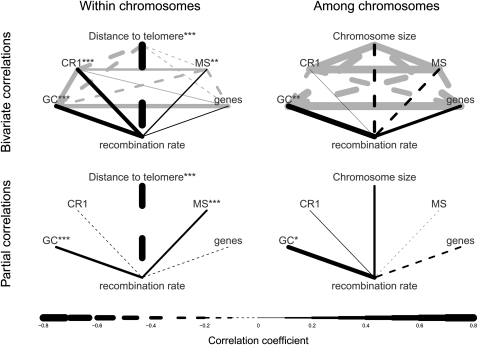
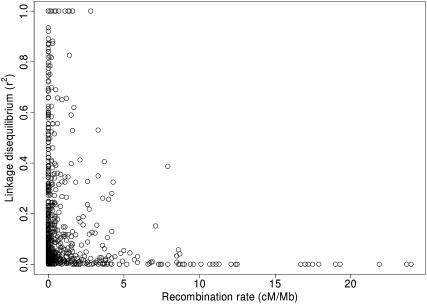
Understanding the causes and consequences of variation in the rate of recombination is essential since this parameter is considered to affect levels of genetic variability, the efficacy of selection, and the design of association and linkage mapping studies. However, there is limited knowledge about the factors governing recombination rate variation. We genotyped 1920 single nucleotide polymorphisms in a multigeneration pedigree of more than 1000 zebra finches (Taeniopygia guttata) to develop a genetic linkage map, and then we used these map data together with the recently available draft genome sequence of the zebra finch to estimate recombination rates in 1 Mb intervals across the genome. The average zebra finch recombination rate (1.5 cM/Mb) is higher than in humans, but significantly lower than in chicken. The local rates of recombination in chicken and zebra finch were only weakly correlated, demonstrating evolutionary turnover of the recombination landscape in birds. The distribution of recombination events was heavily biased toward ends of chromosomes, with a stronger telomere effect than so far seen in any organism. In fact, the recombination rate was as low as 0.1 cM/Mb in intervals up to 100 Mb long in the middle of the larger chromosomes. We found a positive correlation between recombination rate and GC content, as well as GC-rich sequence motifs. Levels of linkage disequilibrium (LD) were significantly higher in regions of low recombination, showing that heterogeneity in recombination rates have left a footprint on the genomic landscape of LD in zebra finch populations.


Figures

Figure 1.
Figure 1.
The zebra finch recombination rate (cM/Mb) in 1-Mb windows plotted against the distance (Mb) to the closest chromosome end.
Figure 2.
Figure 2.
The relationship between the genetic (cM) and the physical (Mb) position of markers in the best-order map built based on the draft sequence of the zebra finch genome. Red and blue circles indicate the female- and male-specific genetic map, respectively. The length of the x-axis reflects the total physical size of the chromosome, as given by the genome assembly. Only chromosomes with >10 markers are included.
Figure 3.
Figure 3.
Box-and-whisker plots for recombination rate in 1-Mb windows across chromosomes. Filled dots show the median and boxes the interquartile ranges. Outside the boxes, whiskers mark the largest and smallest values within 1.5 times the interquartile range, and open dots show data points outside the whisker range.
Figure 4.
Figure 4.
The relationship between the distance to the chromosome end (Mb) and the recombination rate (cM) measured in 5-Mb windows in zebra finch (this study), chicken (Groenen et al. 2009), mouse and human (Jensen-Seaman et al. 2004).
Figure 5.
Figure 5.
Correlations between recombination rate and genomic parameters. The upper two plots show raw pairwise correlations between genomic parameters and recombination rate, while the lower two plots show partial correlations controlling for all other genomic parameters in the plot. (Solid lines) Positive correlations; (dashed lines) negative correlations. Line width is proportional to the strength of the correlations. Gray lines show correlations among genomic parameters. Asterisks indicate significance levels for correlations with recombination rate (black lines; *P < 0.05; **P < 0.01; ***P < 0.001). CR1, chicken repeat 1 retrotransposon; MS, microsatellites.
Figure 6.
Figure 6.
The relationship between the recombination rate (cM/Mb) and the level of linkage disequilibrium (r2) for all adjacent marker pairs within linkage groups in the zebra finch genetic map.

References

    1. Aerts J, Megens HJ, Veenendaal T, Ovcharenko I, Crooijmans R, Gordon L, Stubbs L, Groenen M. Extent of linkage disequilibrium in chicken. Cytogenet Genome Res. 2007;117:338–345. - PubMed
    1. Amaral AJ, Megens H-J, Crooijmans RPMA, Heuven HCM, Groenen MAM. Linkage disequilibrium decay and haplotype block structure in the pig. Genetics. 2008;179:569–579. - PMC - PubMed
    1. Andreescu C, Avendano S, Brown SR, Hassen A, Lamont SJ, Dekkers JCM. Linkage disequilibrium in related breeding lines of chickens. Genetics. 2007;177:2161–2169. - PMC - PubMed
    1. Arnheim N, Calabrese P, Nordborg M. Hot and cold spots of recombination in the human genome: The reason we should find them and how this can be achieved. Am J Hum Genet. 2003;73:5–16. - PMC - PubMed
    1. Backström N, Qvarnström A, Gustafsson L, Ellegren H. Levels of linkage disequilibrium in a wild bird population. Biol Lett. 2006;2:435–438. - PMC - PubMed

Publication types