

Sex bias and dosage compensation in the zebra finch versus chicken genomes: general and specialized patterns among birds
- PMID: 20357053
- PMCID: PMC2847754
- DOI: 10.1101/gr.102343.109
Sex bias and dosage compensation in the zebra finch versus chicken genomes: general and specialized patterns among birds
Abstract
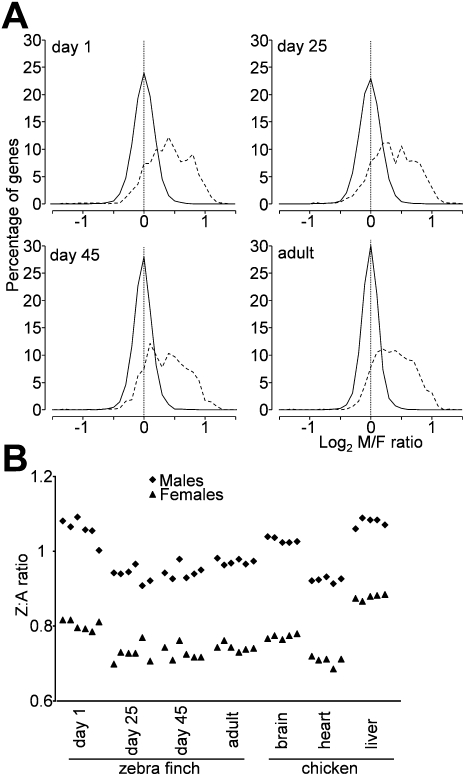
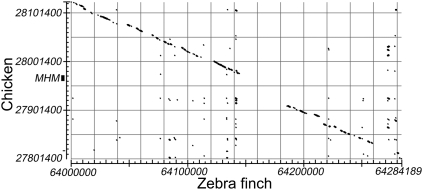
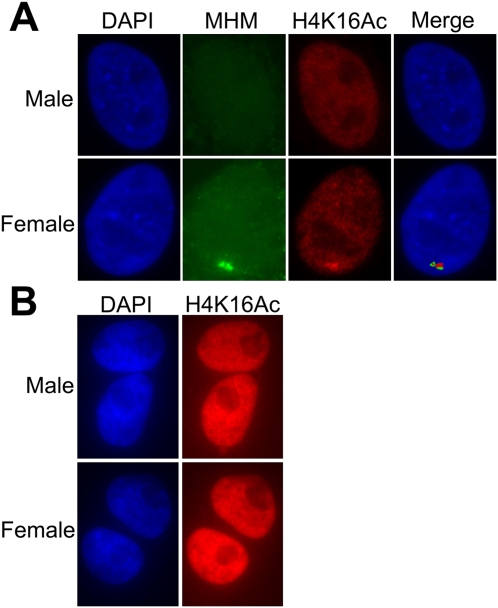
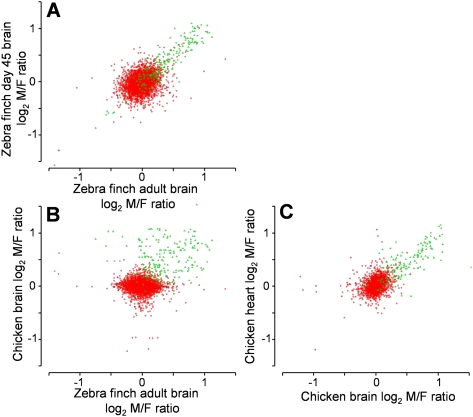
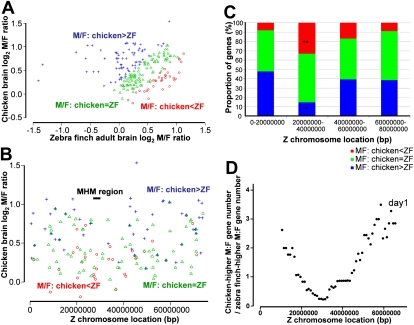
We compared global patterns of gene expression between two bird species, the chicken and zebra finch, with regard to sex bias of autosomal versus Z chromosome genes, dosage compensation, and evolution of sex bias. Both species appear to lack a Z chromosome-wide mechanism of dosage compensation, because both have a similar pattern of significantly higher expression of Z genes in males relative to females. Unlike the chicken Z chromosome, which has female-specific expression of the noncoding RNA MHM (male hypermethylated) and acetylation of histone 4 lysine 16 (H4K16) near MHM, the zebra finch Z chromosome appears to lack the MHM sequence and acetylation of H4K16. The zebra finch also does not show the reduced male-to-female (M:F) ratio of gene expression near MHM similar to that found in the chicken. Although the M:F ratios of Z chromosome gene expression are similar across tissues and ages within each species, they differ between the two species. Z genes showing the greatest species difference in M:F ratio were concentrated near the MHM region of the chicken Z chromosome. This study shows that the zebra finch differs from the chicken because it lacks a specialized region of greater dosage compensation along the Z chromosome, and shows other differences in sex bias. These patterns suggest that different avian taxa may have evolved specific compensatory mechanisms.
Figures

Similar articles
-
Dosage compensation is less effective in birds than in mammals.J Biol. 2007;6(1):2. doi: 10.1186/jbiol53. J Biol. 2007. PMID: 17352797 Free PMC article.
-
Regional differences in dosage compensation on the chicken Z chromosome.Genome Biol. 2007;8(9):R202. doi: 10.1186/gb-2007-8-9-r202. Genome Biol. 2007. PMID: 17900367 Free PMC article.
-
Possible differences in the two Z chromosomes in male chickens and evolution of MHM sequences in Galliformes.Chromosoma. 2011 Dec;120(6):587-98. doi: 10.1007/s00412-011-0333-x. Epub 2011 Jul 27. Chromosoma. 2011. PMID: 21792594
-
Avian sex, sex chromosomes, and dosage compensation in the age of genomics.Chromosome Res. 2014 Apr;22(1):45-57. doi: 10.1007/s10577-014-9409-9. Chromosome Res. 2014. PMID: 24599719 Review.
-
A bird's-eye view of sex chromosome dosage compensation.Annu Rev Genomics Hum Genet. 2008;9:109-27. doi: 10.1146/annurev.genom.9.081307.164220. Annu Rev Genomics Hum Genet. 2008. PMID: 18489256 Review.
Cited by
-
Dosage compensation of the sex chromosomes.Annu Rev Genet. 2012;46:537-60. doi: 10.1146/annurev-genet-110711-155454. Epub 2012 Sep 4. Annu Rev Genet. 2012. PMID: 22974302 Free PMC article. Review.
-
Determination of dosage compensation of the mammalian X chromosome by RNA-seq is dependent on analytical approach.BMC Genomics. 2013 Mar 6;14:150. doi: 10.1186/1471-2164-14-150. BMC Genomics. 2013. PMID: 23497106 Free PMC article.
-
The timing of genetic degeneration of sex chromosomes.Philos Trans R Soc Lond B Biol Sci. 2021 Aug 30;376(1832):20200093. doi: 10.1098/rstb.2020.0093. Epub 2021 Jul 12. Philos Trans R Soc Lond B Biol Sci. 2021. PMID: 34247501 Free PMC article. Review.
-
Resistant and susceptible chicken lines show distinctive responses to Newcastle disease virus infection in the lung transcriptome.BMC Genomics. 2017 Dec 28;18(1):989. doi: 10.1186/s12864-017-4380-4. BMC Genomics. 2017. PMID: 29281979 Free PMC article.
-
Lack of dosage compensation accompanies the arrested stage of sex chromosome evolution in ostriches.Mol Biol Evol. 2013 Apr;30(4):806-10. doi: 10.1093/molbev/mst009. Epub 2013 Jan 16. Mol Biol Evol. 2013. PMID: 23329687 Free PMC article.
References
-
- Arnold AP, Itoh Y, Melamed E. A bird's-eye view of sex chromosome dosage compensation. Annu Rev Genomics Hum Genet. 2008;9:109–127. - PubMed
-
- Baverstock PR, Adams M, Polkinghorne RW, Gelder M. A sexlinked enzyme in birds-Z-chromosome conservation but no dosage compensation. Nature. 1982;296:763–766. - PubMed
-
- Benjamini Y, Hochberg Y. Controlling the false discovery rate: A practical and powerful approach to multiple testing. J R Stat Soc Ser B Methodol. 1995;57:289–300.
-
- Birchler JA, Fernandez HR, Kavi HH. Commonalities in compensation. BioEssays. 2006;28:565–568. - PubMed
-
- Bisoni L, Batlle-Morera L, Bird AP, Suzuki M, McQueen HA. Female-specific hyperacetylation of histone H4 in the chicken Z chromosome. Chromosome Res. 2005;13:205–214. - PubMed
Publication types
MeSH terms
Substances
Grants and funding
LinkOut - more resources
Full Text Sources
Other Literature Sources
Molecular Biology Databases