. 2010 Jun;84(12):5936-46.
doi: 10.1128/JVI.02344-09. Epub 2010 Mar 31.

Hepatitis C virus differentially modulates activation of forkhead transcription factors and insulin-induced metabolic gene expression

Affiliations

Hepatitis C virus differentially modulates activation of forkhead transcription factors and insulin-induced metabolic gene expression

Arup Banerjee et al. J Virol. 2010 Jun.

Abstract

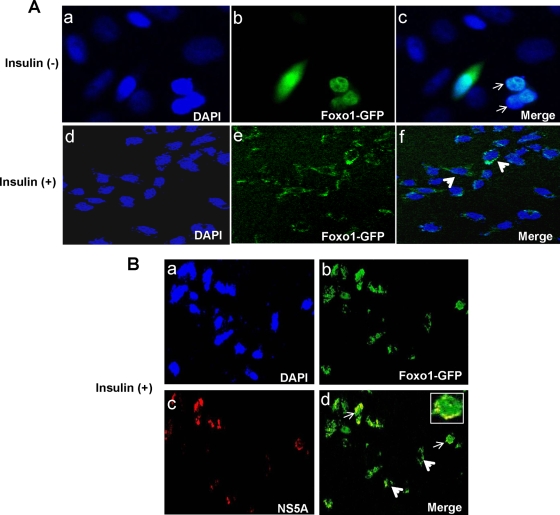
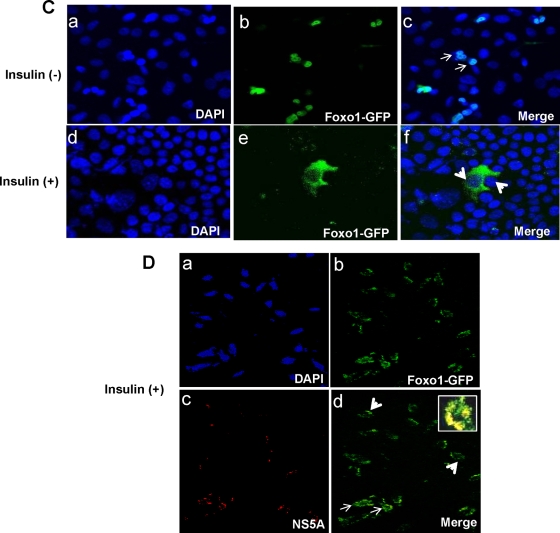
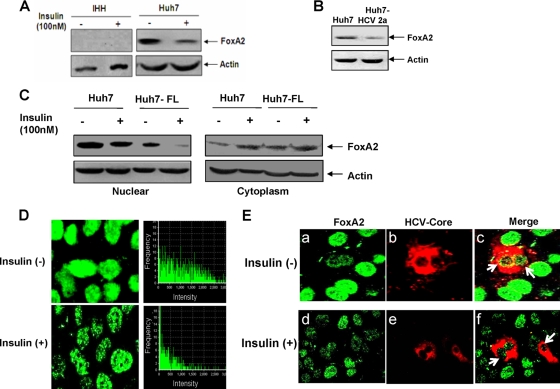
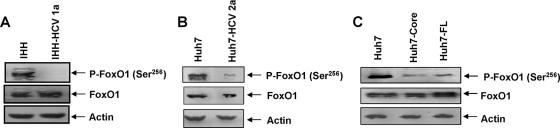
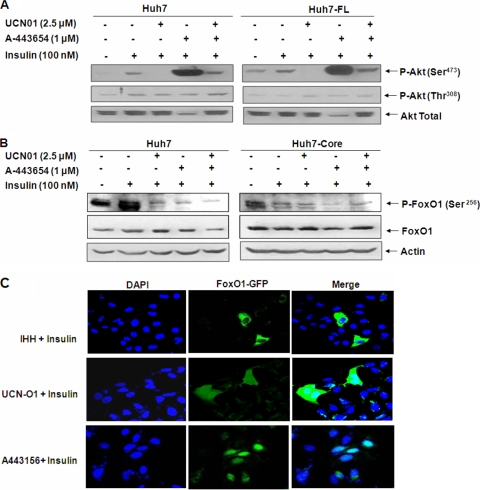
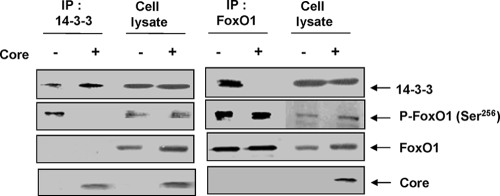
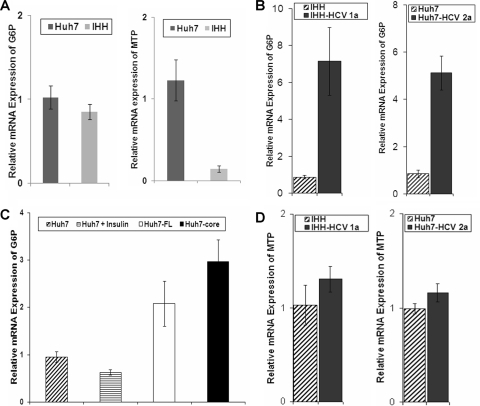
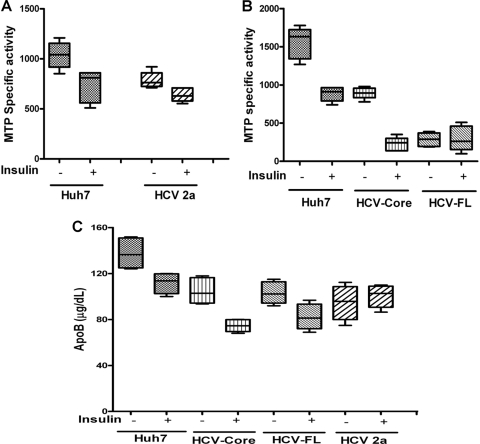
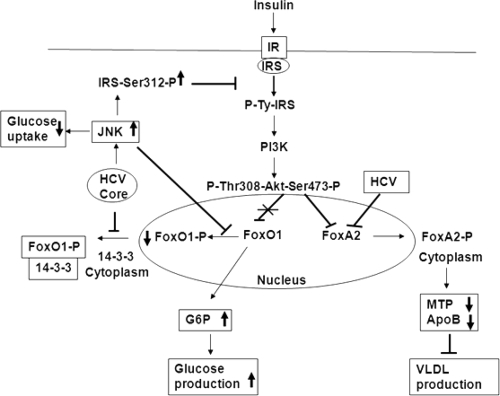
Chronic hepatitis C virus (HCV) infection is often associated with insulin resistance and hepatic steatosis. Insulin regulates gene expression of key enzymes in glucose and lipid metabolism by modulating the activity of specific Forkhead box transcriptional regulators (FoxO1 and FoxA2) via the phosphatidylinositol 3-kinase (PI3K)-Akt signaling pathway in the liver. In this study, we observed that HCV infection of human hepatocytes impaired insulin-induced FoxO1 translocation from the nucleus to the cytoplasm and significantly reduced accumulation of FoxA2 in the nucleus. Phosphorylation of FoxO1 at Ser(256), a downstream target for Akt, was inhibited in hepatocytes infected with HCV or expressing the core protein or full-length (FL) genome of HCV. Further, an interaction between FoxO1 and 14-3-3 protein, important for FoxO1 translocation, was inhibited in HCV core-expressing cells. Hepatocytes infected with HCV, expressing the core protein alone or polyprotein displayed an increased level of glucose-6-phosphatase (G6P) mRNA. On the other hand, microsomal triglycerol transfer protein (MTP) activity and apolipoprotein B (ApoB) secretion were significantly reduced in hepatocytes expressing HCV proteins. Together, these observations suggest that HCV infection or ectopic expression of the core protein either alone or together with other viral proteins from an FL gene construct differentially modulates FoxO1 and FoxA2 activation and affects insulin-induced metabolic gene regulation in human hepatocytes.


Figures

FIG. 1.
FIG. 1.
HCV infection impairs insulin-induced translocation of FoxO1 from the nucleus to the cytoplasm. (A) Mock-infected IHHs were transfected with FoxO1-GFP, fixed, and stained with DAPI. Confocal microscopy suggests that FoxO1 is located primarily in the nucleus. Merged green and blue images are shown by arrows. Insulin treatment translocated FoxO1 from the nucleus to the cytoplasm in most of the hepatocytes, as shown by the arrows. (C) Similar results were observed with Huh7 cells. (B) IHHs were infected with HCV genotype 1a and transfected with FoxO1-GFP, fixed, and stained with DAPI. Hepatocytes were stained with a monoclonal antibody to NS5A and a secondary antibody conjugated with Alexa Fluor 598. Hepatocytes displayed localization of the viral protein as red in the cytoplasms of infected cells. Confocal microscopy displayed the nucleo-cytoplasmic localization of FoxO1 as green in a number of HCV-infected cells following insulin treatment (indicated by arrows), while the cytoplasms of cells not stained for viral protein had a distinct green fluorescence (indicated by arrowhead). The inset image exhibits merged red and green fluorescence at a higher magnification. (D) Similar observations were noted with Huh7 cells infected with HCV genotype 2a.
FIG. 1.
FIG. 1.
HCV infection impairs insulin-induced translocation of FoxO1 from the nucleus to the cytoplasm. (A) Mock-infected IHHs were transfected with FoxO1-GFP, fixed, and stained with DAPI. Confocal microscopy suggests that FoxO1 is located primarily in the nucleus. Merged green and blue images are shown by arrows. Insulin treatment translocated FoxO1 from the nucleus to the cytoplasm in most of the hepatocytes, as shown by the arrows. (C) Similar results were observed with Huh7 cells. (B) IHHs were infected with HCV genotype 1a and transfected with FoxO1-GFP, fixed, and stained with DAPI. Hepatocytes were stained with a monoclonal antibody to NS5A and a secondary antibody conjugated with Alexa Fluor 598. Hepatocytes displayed localization of the viral protein as red in the cytoplasms of infected cells. Confocal microscopy displayed the nucleo-cytoplasmic localization of FoxO1 as green in a number of HCV-infected cells following insulin treatment (indicated by arrows), while the cytoplasms of cells not stained for viral protein had a distinct green fluorescence (indicated by arrowhead). The inset image exhibits merged red and green fluorescence at a higher magnification. (D) Similar observations were noted with Huh7 cells infected with HCV genotype 2a.
FIG. 2.
FIG. 2.
HCV reduces accumulation of FoxA2 in the nucleus. (A) Western blots showing FoxA2 status in insulin-treated and untreated hepatocytes. Blots were reprobed with an antibody to actin to ascertain the level of protein load in each lane. (B) Western blots showing a reduction in the level of FoxA2 in HCV genotype 2a-infected Huh7 cells. Blots were reprobed with an antibody to actin for comparison of protein load. (C) Distribution patterns of FoxA2 in nuclear and cytoplasmic fractions of Huh7 cells expressing HCV-FL in insulin-treated and untreated cells are shown. (D) Huh7 cells were treated with insulin (100 nM) or untreated, and FoxA2 was stained with a specific antibody and a secondary antibody conjugated to Alexa Fluor 488 (green). FoxA2 was retained exclusively in the nucleus in the absence of insulin. Cells treated with insulin displayed a reduced level of FoxA2 accumulation in the nucleus. Fluorescence frequency intensities (green) from randomly selected fields determined by using FluoView software (Olympus) are shown. (E) Huh7 cells were infected with HCV genotype 2a. Cells were treated with insulin 5 days postinfection or left untreated and were similarly stained for FoxA2 (green) (a and d) and HCV core (red) (b and e). Cells expressing HCV core (red) displayed a reduced level of FoxA2 in the nucleus (green); a merged photograph is indicated by arrowheads (c). Insulin treatment also reduced the level of FoxA2 in the nuclei of uninfected hepatocytes (f).
FIG. 3.
FIG. 3.
Hepatocytes expressing HCV proteins inhibit FoxO1 Ser256 phosphorylation. Lysates from IHHs infected with HCV genotype 1a (A) or Huh7 cells infected with HCV genotype 2a (B) were analyzed for phosphorylated FoxO1 Ser256 [P-FoxO1(Ser256)] and total FoxO1 status and were compared with mock-infected control cells by Western blot analysis, using specific antibodies. (C) HCV core- or FL-transfected Huh7 cells were similarly analyzed for FoxO1 status. Blots were reprobed with an antibody to actin to ascertain the level of protein load in each lane.
FIG. 4.
FIG. 4.
FoxO1 phosphorylation in HCV protein-expressing hepatocytes is insensitive to Akt inhibitors. (A) Akt phosphorylation status in hepatocytes expressing the HCV FL gene in the presence of phosphorylation inhibitors. Blots were reprobed with an antibody to actin to ascertain the level of protein load in each lane. (B) Western blots showing the Ser256 phosphorylation status of P-FoxO1 and total FoxO1 in insulin-treated control and HCV core-transfected cell lysates following incubation with UCN-O1 and/or A443654 inhibitors. Blots were reprobed with an antibody to actin to ascertain the level of protein load in each lane. (C) Insulin-treated IHHs displaying translocation of GFP-tagged FoxO1 from the nucleus to the cytoplasm and Akt phosphorylation inhibitors preventing cytoplasmic translocation of GFP-tagged FoxO1. The panels on the right show merged images of DAPI-stained and GFP-expressing hepatocytes.
FIG. 5.
FIG. 5.
HCV core protein inhibits insulin-induced association of 14-3-3 and FoxO1 proteins. Huh7 cells were transfected with a HCV core construct and immunoprecipitated endogenous 14-3-3, P-FoxO1, or HCV core proteins by specific antibodies. Immunoprecipitates (IP) were analyzed by Western blotting for detection of coprecipitating proteins.
FIG. 6.
FIG. 6.
HCV-infected hepatocytes differentially modulate G6P and MTP mRNA expression. (A) Real-time PCR was performed to determine the mRNA status of G6P and MTP. GAPDH was used as a housekeeping gene for endogenous control. (B and C) G6P expression in IHHs infected with HCV genotype 1a or Huh7 cells infected with HCV genotype 2a (B) and in HCV polyprotein- or core-expressing cells (C) compared to that in uninfected Huh7 cells used as controls. P values for the numbers of control and experimental hepatocytes in panels B and C that were infected with HCV or that express core or FL HCV indicate a significant difference (P < 0.05). (D) MTP expression in hepatocytes infected with HCV genotype 1a or 2a as determined by real-time PCR. Triplicate sets of experiments were performed, and relative expression levels were estimated for each set of experiments. The basal value from parental control hepatocytes (IHHs or Huh7 cells) was arbitrarily set at 1, and standard deviations are represented as error bars.
FIG. 7.
FIG. 7.
HCV infection or protein expression in hepatocytes reduces MTP activity and ApoB secretion. (A) MTP transfer activity in HCV genotype 2a-infected Huh7 cells and mock-infected controls was measured by a fluorescent assay and expressed as specific activity (mean percent transfer/mg total proteins/h of triplicate quantifications). (B) Similarly, MTP activity was determined in control, HCV core-, and HCV FL-expressing Huh7 cells. (C) ApoB secretion was analyzed in the supernatants of hepatocytes treated with serum-free medium alone or with medium containing insulin (100 nM) for 24 h. Results from three independent experiments are shown. Boxes indicate upper and lower quartiles; horizontal lines inside boxes indicate median values. The P values for the differences in ApoB secretion between control, HCV genotype 2a-infected cells (P < 0.05), HCV core-expressing cells (P < 0.01), and HCV FL-expressing cells (P < 0.05) were statistically significant.
FIG. 8.
FIG. 8.
Schematic presentation of the signaling pathway induced by HCV for metabolic regulation. Based on our previous and current observations, we propose that HCV may interrupt at different nodes of the metabolic signaling pathway for insulin resistance and lipid metabolism. Core protein activates JNK and upregulates IRS Ser312 phosphorylation, thus inhibiting glucose uptake (7). On the other hand, core protein inhibits phospho-FoxO1 and 14-3-3 protein interaction and thus may impair FoxO1 translocation from the nucleus to the cytoplasm, or activated JNK may have a role in the regulation of FoxO1 phosphorylation (15). This leads to upregulation of G6P in the nucleus and enables an increase in glucose synthesis. HCV inactivates FoxA2 by increasing cytoplasmic translocation, leading to lower levels of MTP activity and ApoB secretion. Bold arrow pointing upward () represent activation, downward-pointing arrows (↓) represent repression, and blunt arrows () represent blockade of signaling.

Similar articles

Cited by

References

    1. Adinolfi, L. E., M. Gambardella, A. Andreana, M. F. Tripodi, R. Utili, and G. Ruggiero. 2001. Steatosis accelerates the progression of liver damage of chronic hepatitis C patients and correlates with specific HCV genotype and visceral obesity. Hepatology 33:1358-1364. - PubMed
    1. Ait-Goughoulte, M., T. Kanda, K. Meyer, J. S. Ryerse, R. B. Ray, and R. Ray. 2008. Hepatitis C virus genotype 1a growth and induction of autophagy. J. Virol. 82:2241-2249. - PMC - PubMed
    1. Altomonte, J., A. Richter, S. Harbaran, J. Suriawinata, J. Nakae, S. N. Thung, M. Meseck, D. Accili, and H. Dong. 2003. Inhibition of Foxo1 function is associated with improved fasting glycemia in diabetic mice. Am. J. Physiol. Endocrinol. Metab. 285:E718-E728. - PubMed
    1. Aoki, H., J. Hayashi, M. Moriyama, Y. Arakawa, and O. Hino. 2000. Hepatitis C virus core protein interacts with 14-3-3 protein and activates the kinase Raf-1. J. Virol. 74:1736-1741. - PMC - PubMed
    1. Asselah, T., L. Rubbia-Brandt, P. Marcellin, and F. Negro. 2006. Steatosis in chronic hepatitis C: why does it really matter? Gut 55:123-130. - PMC - PubMed

Publication types

MeSH terms