. 2010 Mar 31;30(13):4815-26.
doi: 10.1523/JNEUROSCI.4360-09.2010.

Mismatched decoding in the brain

Affiliations

Mismatched decoding in the brain

Masafumi Oizumi et al. J Neurosci. .

Abstract

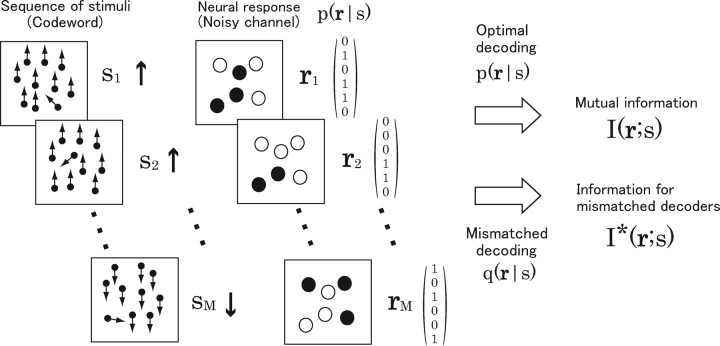
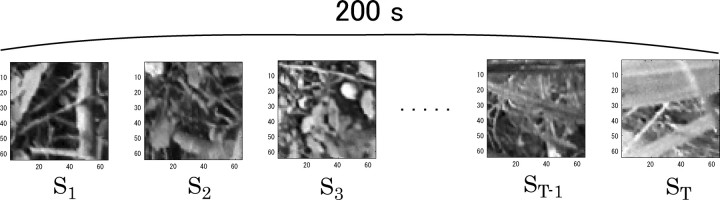
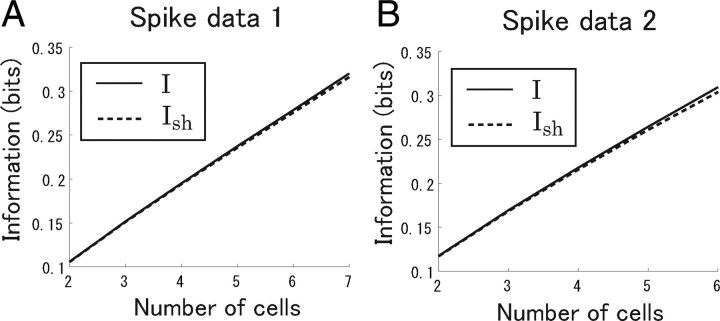
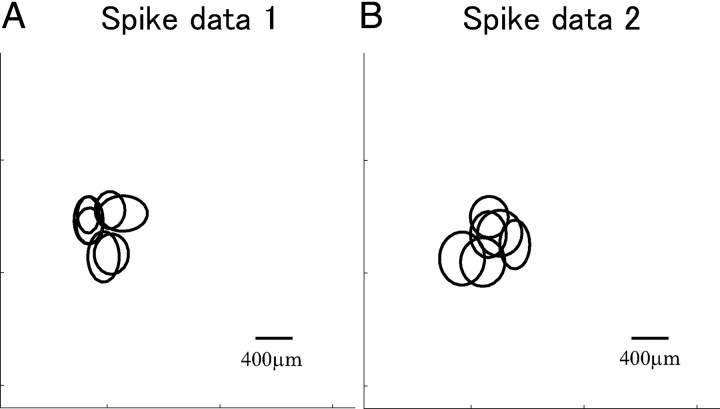
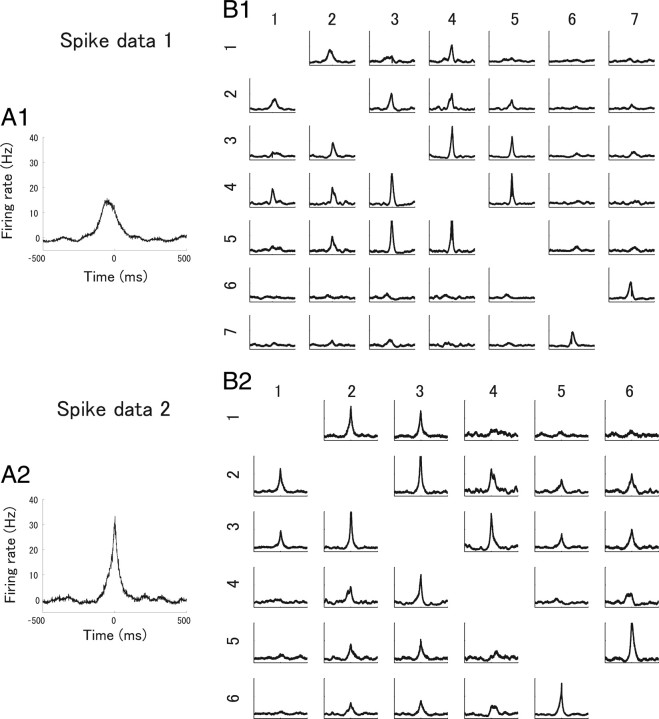
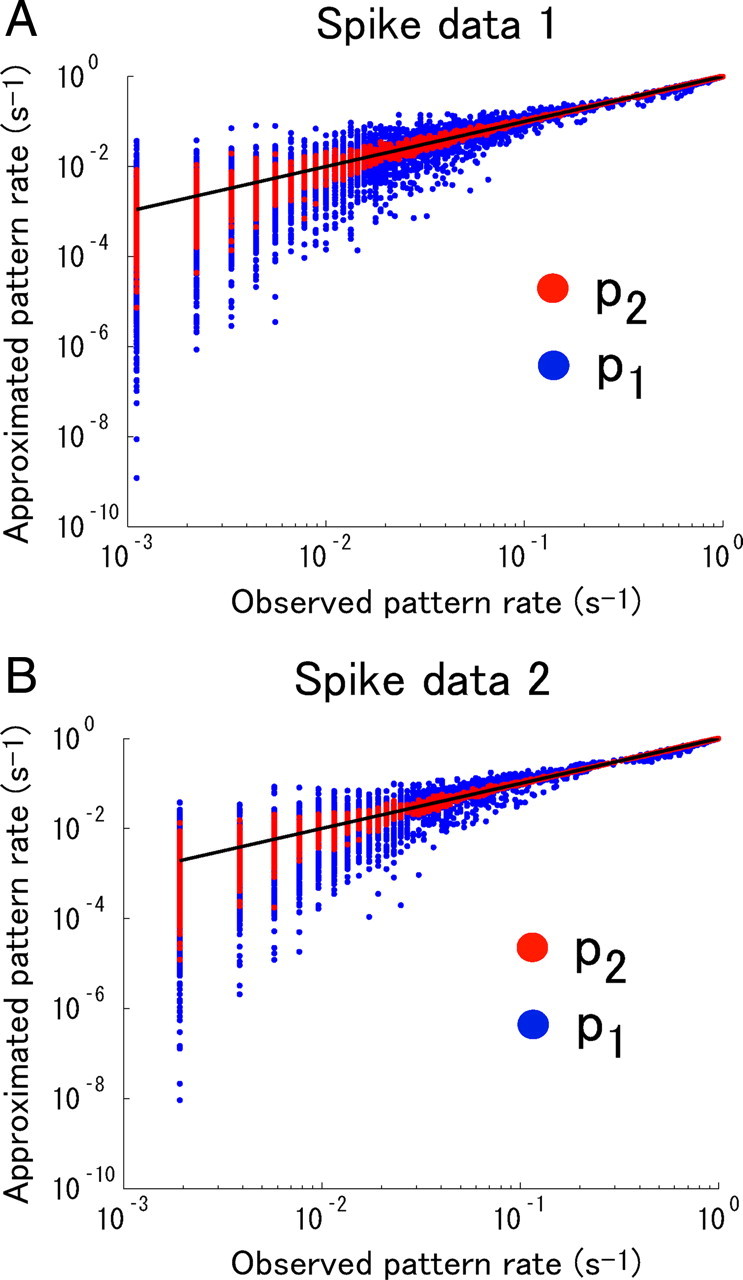
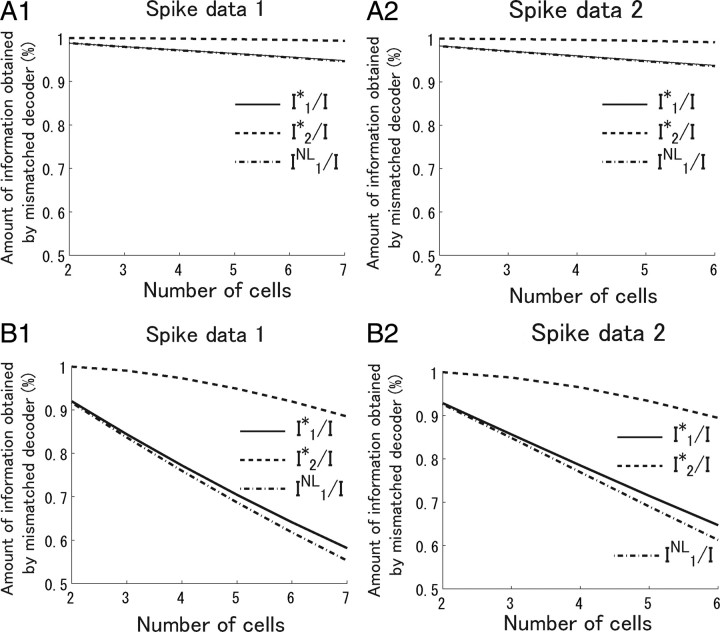
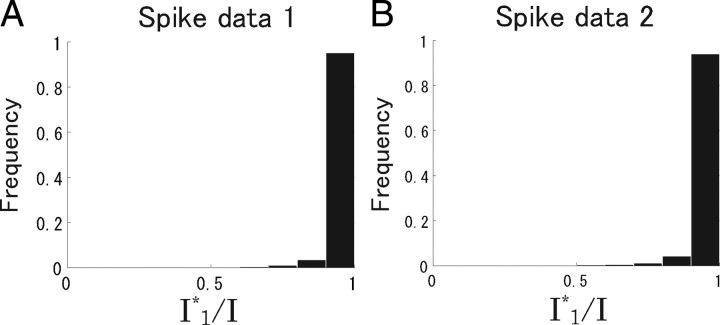
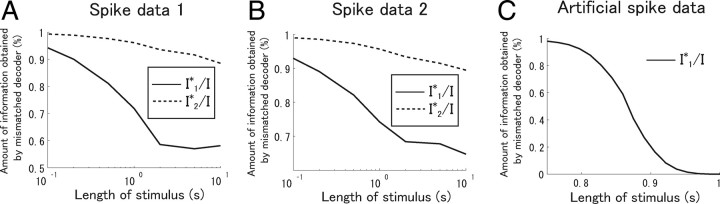
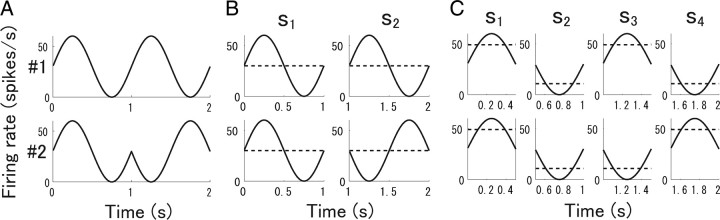
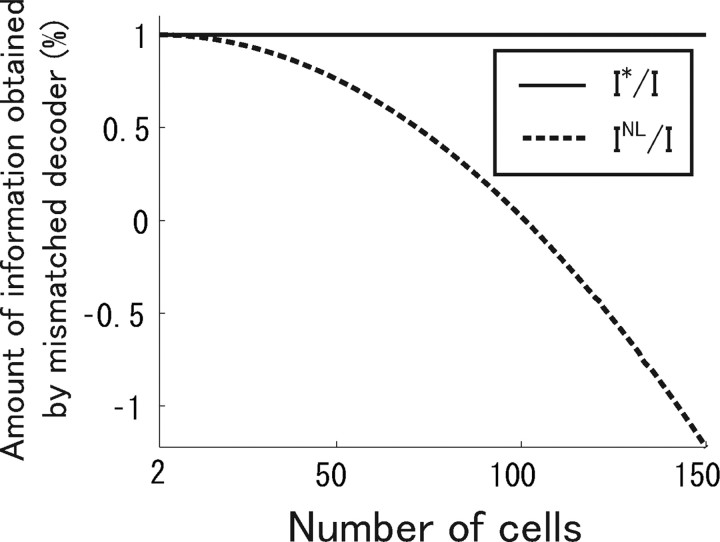
"How is information decoded in the brain?" is one of the most difficult and important questions in neuroscience. We have developed a general framework for investigating to what extent the decoding process in the brain can be simplified. First, we hierarchically constructed simplified probabilistic models of neural responses that ignore more than Kth-order correlations using the maximum entropy principle. We then computed how much information is lost when information is decoded using these simplified probabilistic models (i.e., "mismatched decoders"). To evaluate the information obtained by mismatched decoders, we introduced an information theoretic quantity, I*, which was derived by extending the mutual information in terms of communication rate across a channel. We showed that I* provides consistent results with the minimum mean-square error as well as the mutual information, and demonstrated that a previously proposed measure quantifying the importance of correlations in decoding substantially deviates from I* when many cells are analyzed. We then applied this proposed framework to spike data for vertebrate retina using short natural scene movies of 100 ms duration as a set of stimuli and computing the information contained in neural activities. Although significant correlations were observed in population activities of ganglion cells, information loss was negligibly small even if all orders of correlation were ignored in decoding. We also found that, if we inappropriately assumed stationarity for long durations in the information analysis of dynamically changing stimuli, such as natural scene movies, correlations appear to carry a large proportion of total information regardless of their actual importance.


Figures

Figure 1.
Figure 1.
Information transmission using stimulus s and neural responses r as symbols when the neural population is considered as a noisy channel. Random-dot stimuli moving upward or downward are considered. Code words encoded with the sequence of stimuli, for example, s 1 s 2sM = ↑↑ · · · ↓, are sent and neural responses of the six neurons to each stimuli, r 1 r 2r M, are received. Neural responses r are binary, either firing (“1”) (filled circles) or silent (“0”) (open circles). The neurons stochastically fire in response to each stimulus s according to the conditional probability distribution p(r|s). The receiver infers which code word is sent from the received neural responses (decoding). When decoding is performed using the actual probability distribution p(r|s), the maximum number of code words which can be sent error-free is quantified by the mutual information I(r;s) (Eq. 2). In contrast, when decoding is performed using a mismatched probability distribution q(r|s), the maximum number of code words which can be sent error-free is quantified by the information for mismatched decoders I*(r;s) (Eqs. 3, 4).
Figure 2.
Figure 2.
Schematic of a set of stimuli over which mutual information was computed. Each short segment, extracted from a movie of natural scenes of 200 s duration, s 1, s 2, s 3, … , sT −1, sT, was considered as one stimulus.
Figure 3.
Figure 3.
Correlation coefficients between the temporally separated frames of a natural scene movie (dashed line). The solid line is a least-squares fit. The fitted function is of the form y(τ) = a 1 exp(−τ/τ1) + a 2 exp(−τ/τ2).
Figure 4.
Figure 4.
A, Raster plot of seven retinal ganglion cells responding to a natural scene movie. B, Transformation of spike trains into binary words.
Figure 5.
Figure 5.
Difference between I (solid line) and I sh (dashed line). Spike data and length of stimuli are the same as in Figure 9, A1 and A2. I is the value of the mutual information that is directly computed from Equation 2. I sh is computed using Equation 21. I provides the upper bound of the real value of the mutual information I real, and I sh provides the lower bound of I real. In other words, I sh < I real < I. The difference between I and I sh is markedly small even when all recorded cells (N = 7 in spike data 1; N = 6 in spike data 2) are analyzed. A, Spike data 1. B, Spike data 2.
Figure 6.
Figure 6.
A, B, Receptive fields of seven OFF cells in spike data 1 (A) and six OFF cells in spike data 2 (B). Ellipses represent 1 SD of the Gaussian fit to the spatial profile of the spike-triggered averages measured from the natural scene movie stimulus.
Figure 7.
Figure 7.
Synchronous firing in a population of retinal ganglion cells. A1, A2, Example cross-correlograms in spike data 1 (A1) and spike data 2 (A2) showing the firing rate of one cell when the time difference between spikes of one cell and the other cell is given. Mean firing rates are subtracted so that the vertical axis shows the excess firing rate from the baseline firing rate. B1, B2, Cross-correlograms of all pairs of recorded cells in spike data 1 (B1) and spike data 2 (B2). The range of the vertical and horizontal axes is the same as that in the example cross-correlograms in A1 and A2.
Figure 8.
Figure 8.
Relationship between the observed frequency of firing patterns and the predicted frequency of firing patterns from an independent model p 1 (blue dots) and second-order correlation model p 2 (red dots) constructed using the maximum entropy method. Natural scene movies of 100 ms duration were used as stimuli. pK(r|s) (K = 1, 2) for all stimuli are plotted against p data(r|s). The black line shows equality of the observed frequency and the predicted frequency of firing patterns. A, Spike data 1. B, Spike data 2.
Figure 9.
Figure 9.
Dependence of the amount of information obtained by simplified decoders on the number of ganglion cells analyzed. The average values of IK* for K = 1, 2 over all possible combinations of recorded cells is shown when the number of cells analyzed is given. Spike data 1 is used in A1 and B1, and spike data 2 in A2 and B2. A1, A2, A natural scene movie of 100 ms duration was considered as the stimulus. B1, B2, A natural scene movie of 10 s duration was considered as the stimulus.
Figure 10.
Figure 10.
Histogram of Ii*/I. All recorded cells (N = 7 in spike data 1; N = 6 in spike data 2) were analyzed. A, Spike data 1. B, Spike data 2.
Figure 11.
Figure 11.
Dependence of the amount of information obtained by simplified decoders on the length of stimuli (Oizumi et al., 2009). All recorded cells (N = 7 spike data 1; N = 6 in spike data 2) were analyzed. A, Spike data 1. B, Spike data 2. C, Artificial spike data generated according to the firing rates shown in Figure 12 A.
Figure 12.
Figure 12.
Firing rates of two model cells. Rate of cell 1 is shown in top panel; rate of cell 2 is shown in bottom panel (Oizumi et al., 2009). A, Firing rates from 0 to 2 s. B, Firing rates (solid line) and mean firing rates (dashed line) when stimulus duration was 1 s. C, Firing rates (solid line) and mean firing rates (dashed line) when stimulus duration was 500 ms.
Figure 13.
Figure 13.
Difference between I*/I (solid line) and I NL/I (dotted line) in a Gaussian model in which correlations and derivatives of mean firing rates are uniform (Oizumi et al., 2009). Correlation parameter c = 0.01.

References

    1. Abbott LF, Dayan P. The effect of correlated variability on the accuracy of a population code. Neural Comput. 1999;11:91–101. - PubMed
    1. Amari S. Information geometry on hierarchy of probability distributions. IEEE Trans Inform Theory. 2001;47:1701–1711.
    1. Amari S, Nakahara H. Correlation and independence in the neural code. Neural Comput. 2006;18:1259–1267. - PubMed
    1. Averbeck BB, Latham PE, Pouget A. Neural correlations, population coding and computation. Nat Rev Neurosci. 2006;7:358–366. - PubMed
    1. Berger A, Della Pietra S, Della Pietra C. A maximum entropy approach to natural language processing. Comput Linguistics. 1996;22:1–36.

Publication types

LinkOut - more resources