Comparative Study
. 2010 May 1;184(9):4749-60.
doi: 10.4049/jimmunol.0904076. Epub 2010 Mar 31.

CD4+CD25+Foxp3+ regulatory T cells optimize diversity of the conventional T cell repertoire during reconstitution from lymphopenia

Affiliations
Comparative Study

CD4+CD25+Foxp3+ regulatory T cells optimize diversity of the conventional T cell repertoire during reconstitution from lymphopenia

Colleen J Winstead et al. J Immunol. .

Abstract

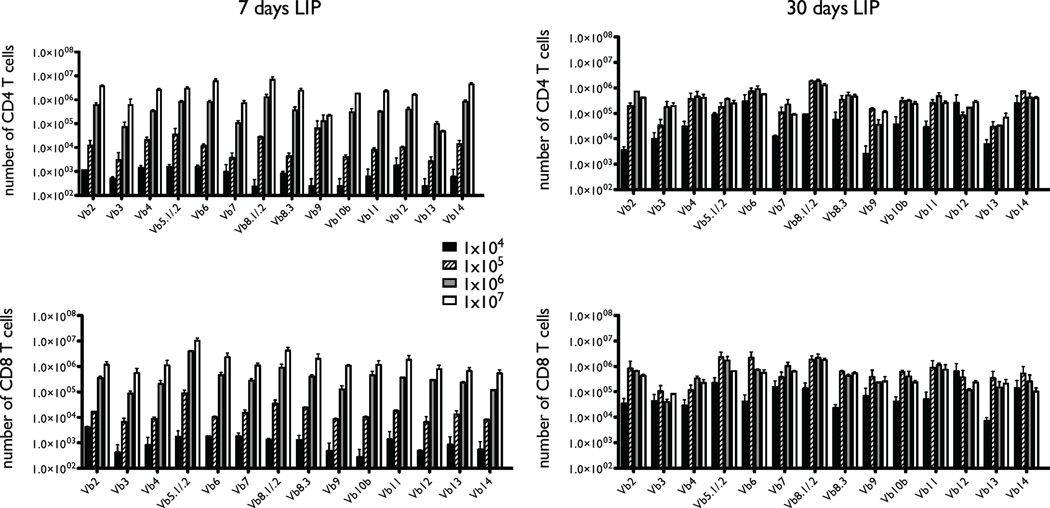
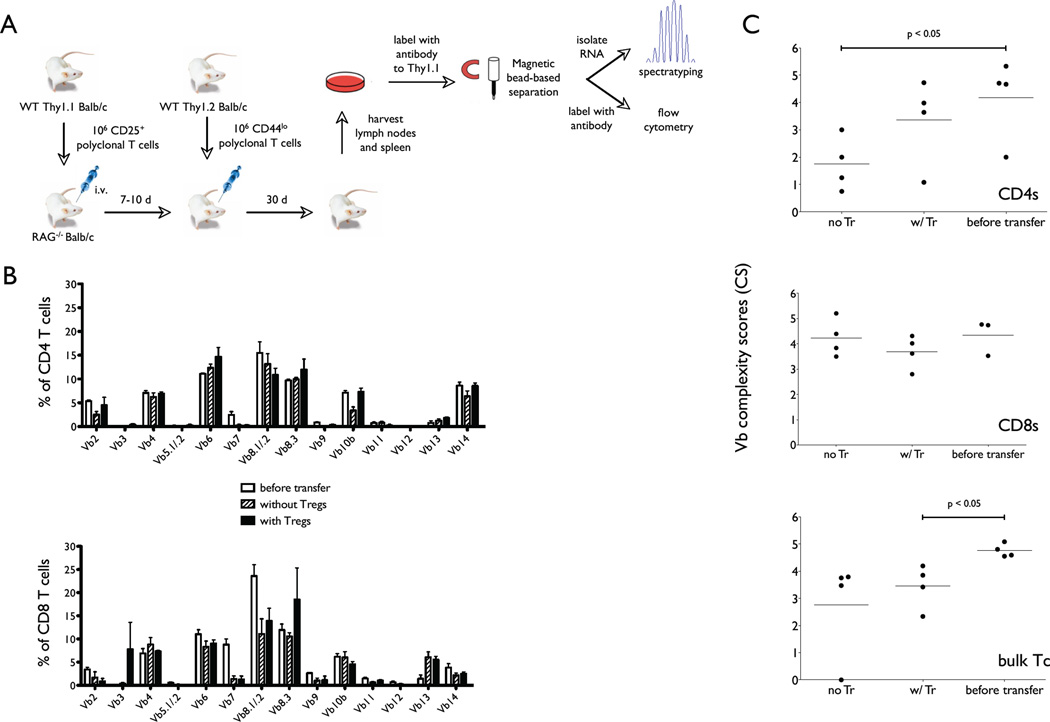
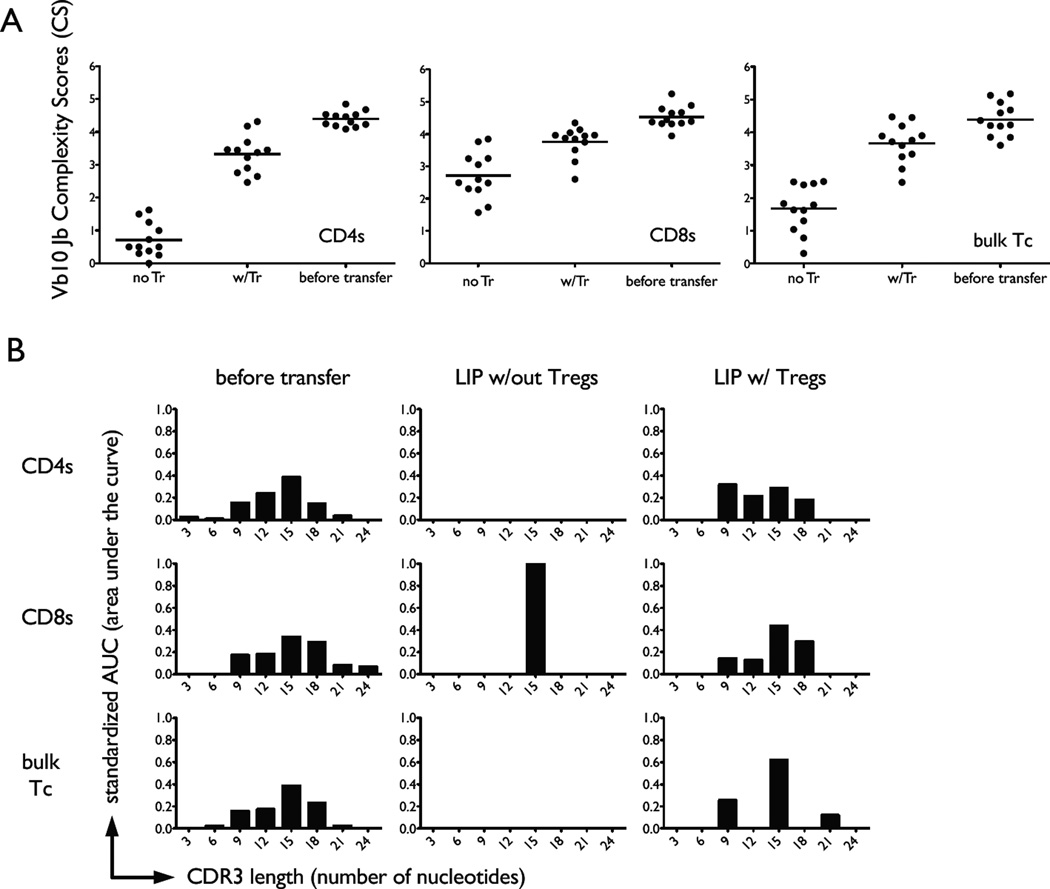
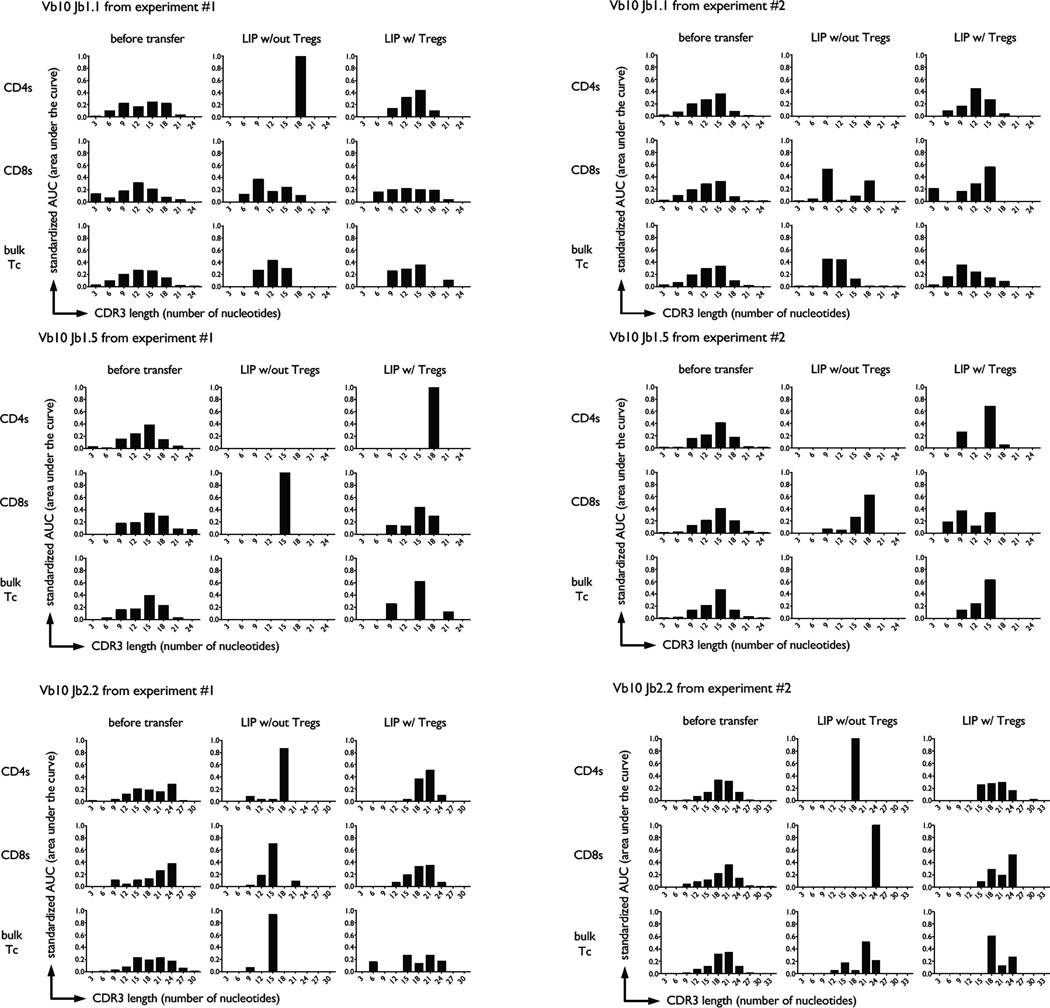
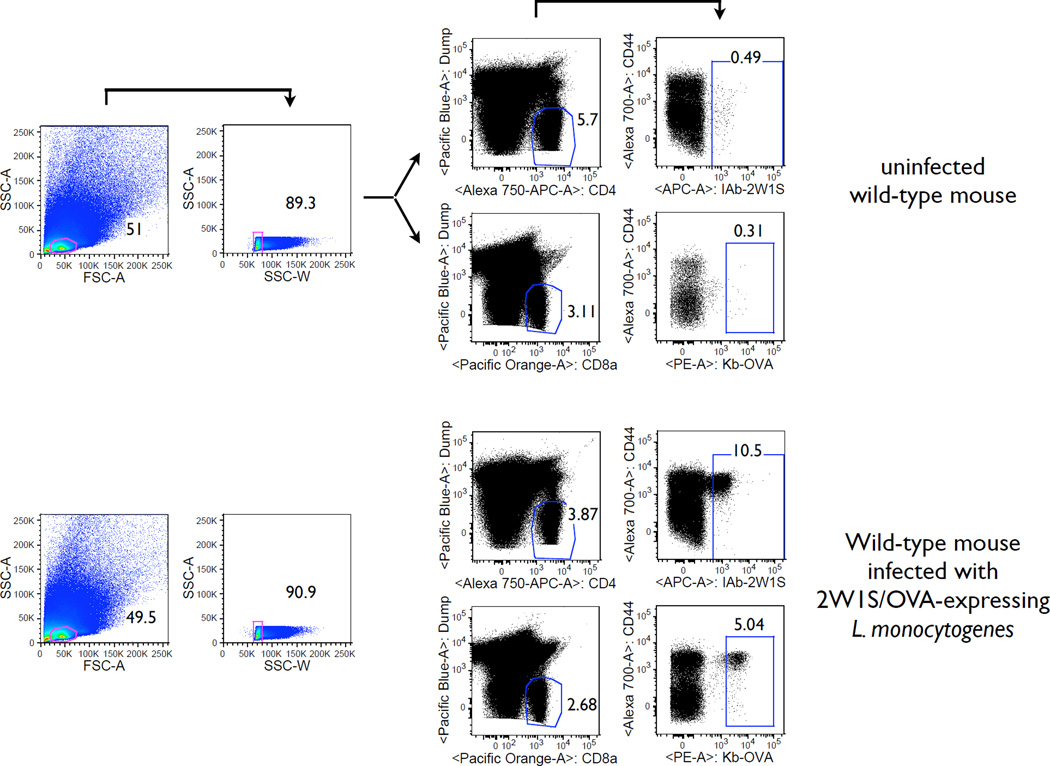
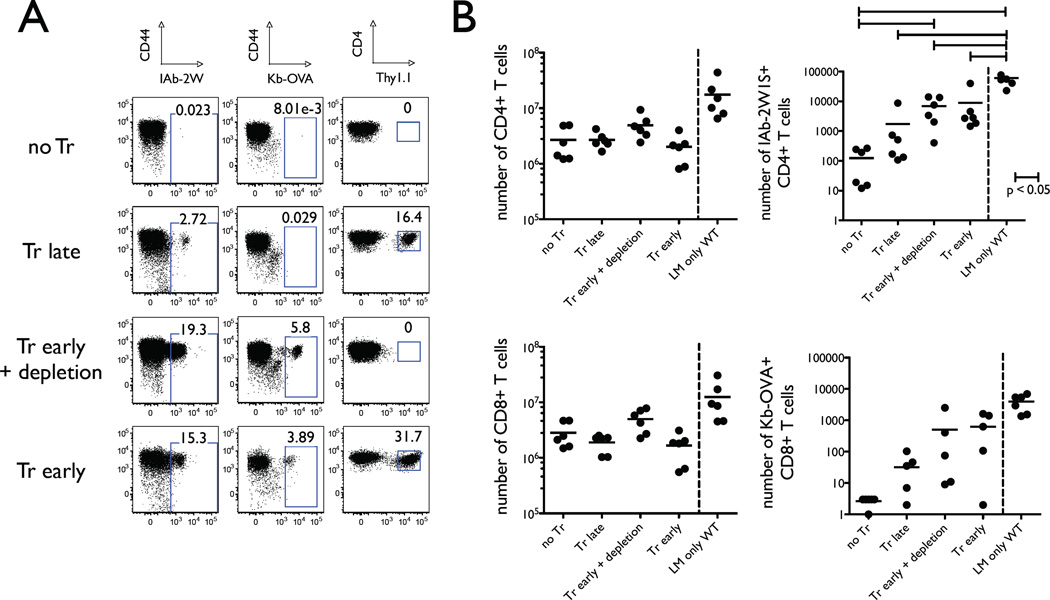
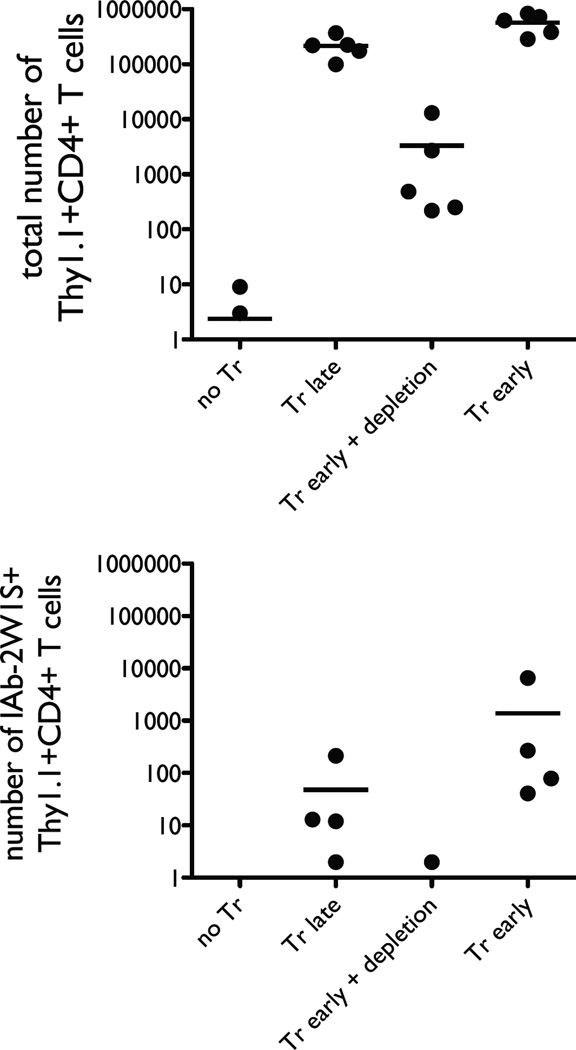
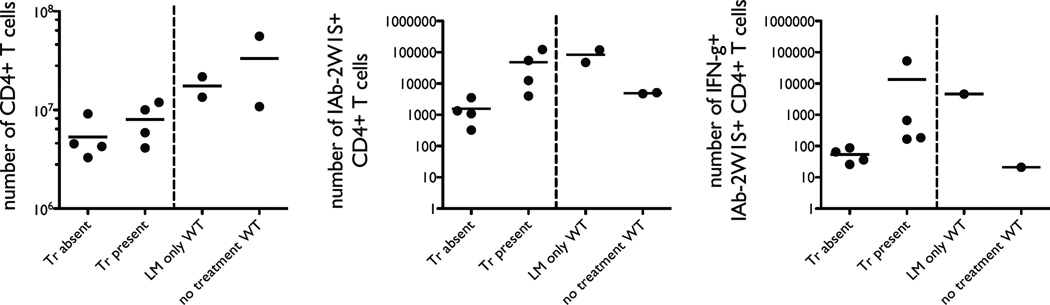
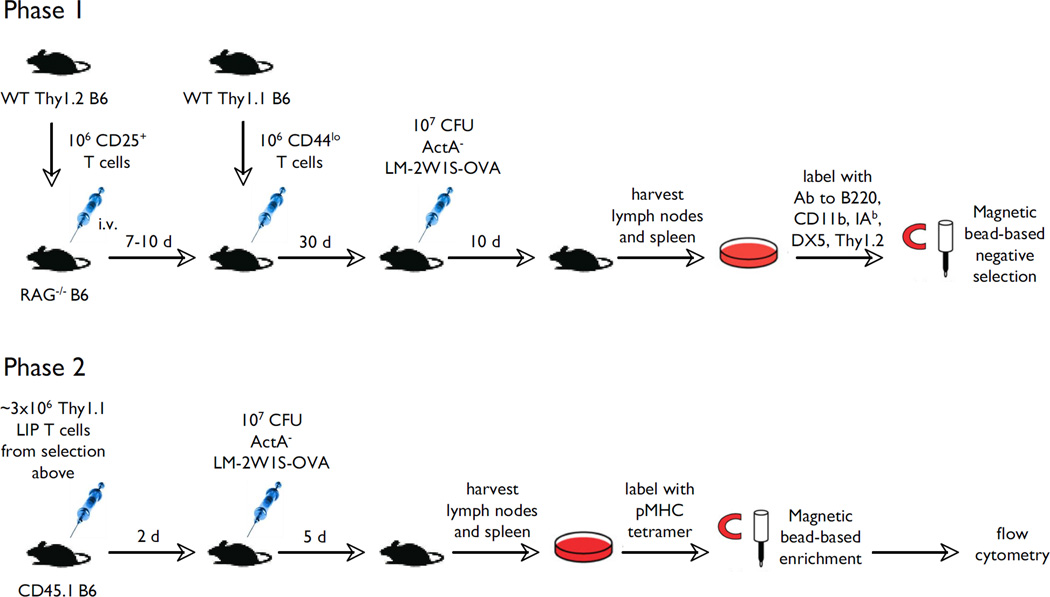
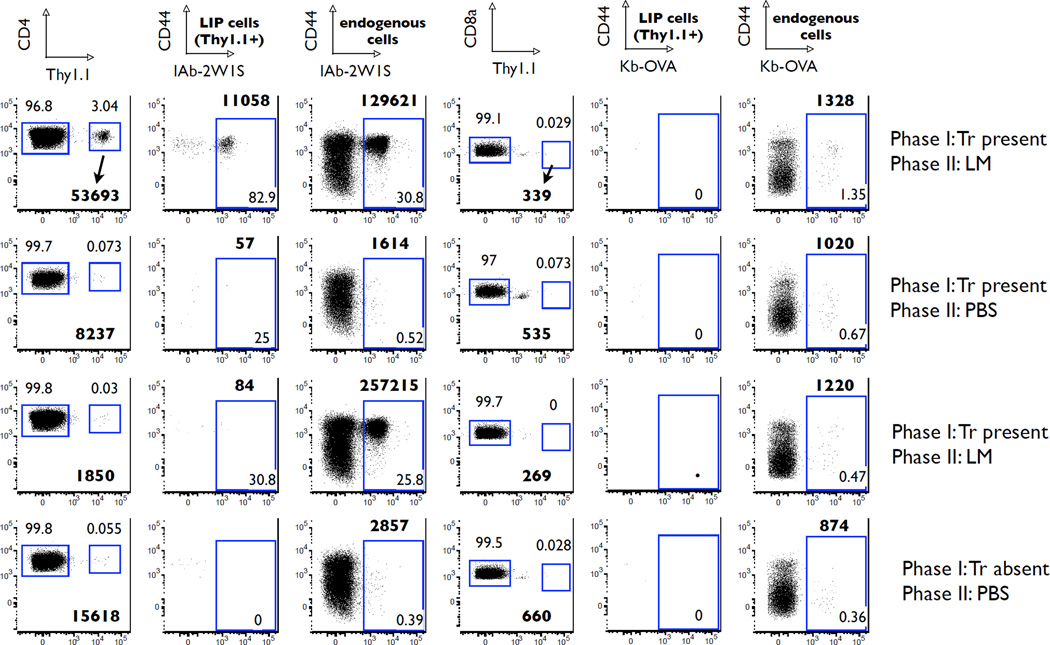
The functional capacity of the adaptive immune system is dependent on the size and the diversity of the T cell population. In states of lymphopenia, T cells are driven to proliferate to restore the T cell population size. However, different T cell clones proliferate at different rates, and some T cells experience burst-like expansion called spontaneous lymphopenia-induced proliferation (LIP). These T cells are likely receiving stimulation from cognate Ags and are most responsible for inflammatory pathology that can emerge in lymphopenic states. Foxp3(+) regulatory T cells (Tregs) selectively inhibit spontaneous LIP, which may contribute to their ability to prevent lymphopenia-associated autoimmunity. We hypothesized that another potential negative consequence of unrestrained spontaneous LIP is constriction of the total T cell repertoire. We demonstrate that the absence of Foxp3(+) Tregs during the period of immune reconstitution results in the development of TCR repertoire "holes" and the loss of Ag-specific responsiveness to infectious microorganisms. In contrast, the presence of Tregs during the period of immune reconstitution preserves optimal TCR diversity and foreign Ag responsiveness. This finding contrasts with the generally accepted immunosuppressive role of Tregs and provides another example of Treg activity that actually enhances immune function.


Figures

FIGURE 1
FIGURE 1
T cell reconstitution in RAG−/− mice following adoptive transfer. Varying numbers of naïve (CD25CD44lo) T cells (104-107) taken from wild-type C57BL/6 mice were transferred into C57BL/6 RAG-1−/− recipients on Day 0 (two recipients per condition). Major lymph nodes (cervical, brachial, axillary, inguinal, and mesenteric) and spleens were harvested on Days 7 and 30, stained for T cell markers (CD4 and CD8) and a panel of antibodies reactive to 14 mouse TCR Vβ chains, and analyzed by FACS. The y-axes indicate the absolute numbers of recovered T cells expressing individual Vβ chains ± variance.
FIGURE 2
FIGURE 2
Assessing T cell diversity at the level of TCR Vβ chain usage after completion of LIP. A, The experiment protocol for assessment of structural T cell diversity post-LIP in the presence or absence of Tregs involves two separate measurements from each sample: TCR Vβ surface staining for FACS, and RNA isolation and spectratyping. B, RAG−/− T cell recipients were sacrificed and lymphoid tissue samples were processed on Day 30 after adoptive transfer. Half of each processed sample was treated to cell surface staining with antibodies specific to T cell markers (CD4, CD8, Thy1.2) and FACS analysis. The panels demonstrate %CD4 T cells (top) and %CD8 T cells (bottom) expressing individual Vβ chains in the input T cell populations (clear bars), and post-LIP T cell populations that emerged in the absence of Tregs (striped bars) or presence of Tregs (black bars). C, The remaining half of each sample was processed for RNA preparation and TCR Vβ spectratyping. The same conditions, i.e., Tregs absent in the recipient mice (no Tr), present (w/Tr), and the input T cell population (before transfer) were tested. Each graphed data bar or point represents an average of 3–4 animals combined from 2 independent experiments. Complexity scores were calculated from spectratyping of Vβ 10 and 8.1 (experiment #1), and from Vβ 10 and 8.3 (experiment #2). The top panel shows complexity scores of the CD4 T cell population; the middle panel shows the complexity scores of the CD8 T cell population, and the bottom panel shows the complexity scores of total, unseparated T cell population (bulk Tc).
FIGURE 3
FIGURE 3
Tregs prevent constriction of the T cell repertoire during LIP. A, RNA samples from CD4 T cells (left panel), CD8 T cells (middle panel) and unseparated T cells (bulk Tc; right panel) from the indicated experimental groups were PCR amplified for Vβ10 expression and spectratyped for CDR3 diversity by further PCR amplification for different Jβ segments. Each dot represents the complexity score for each individual Jβ chain from two separate experiments. A mean value representing data from all 12 chains under each treatment condition (post-LIP in the absence (no Tr) or presence (w/Tr) of Tregs and input T cell populations labeled as ‘before transfer’) was used to determine statistical significance. Statistical significance (p < 0.05) between indicated groups is marked with a horizontal bar.
FIGURE 4
FIGURE 4
Repertoire ‘holes’ develop during LIP in absence of Tregs. Three different T cell populations were adoptively transferred into individual RAG−/− mice: CD4 T cells (CD8-CD44loCD25-), CD8 T cells (CD4-CD44loCD25-), or bulk T cells (CD44loCD25-). Representative CDR3 length bar graph histograms from for individual Vβ10Jβ TCR segments are shown in this figure. Panels A and B represent different experiments. Histograms from the same individual animal are shown per experiment and the specific experimental condition.
FIGURE 5
FIGURE 5
Antigen-specific T cells are enumerated in the secondary lymphoid tissues following L. monocytogenes infection. The antigen-specific T cells were enriched using tetramer-bound magnetic beads. The gating strategy is shown in the Figure. First, a tight lymphocyte gate is imposed that excludes doublet events (SSC-W). Next, non-T cells are excluded by using a ‘dump’ channel. Finally, antigen-specific T cells are gated using fluorochrome-bound tetramers. As expected, antigen-specific T cells are rare before the infection and mostly CD44low. After the infection their numbers increase dramatically, and they become CD44high.
FIGURE 6
FIGURE 6
Presence of Tregs during LIP preserves capacity of the T cell population to respond to foreign antigens. RAG−/− mice were adoptively transferred with naïve Thy1.2 T cells on day 0 and infected with the attenuated L. monocytogenes bacteria expressing 2W1S and OVA peptides on day 30. The lymphoid tissues were harvested for analysis on day 40. The four experimental groups differed by the timing and presence of adoptively transferred Thy1.1 Tregs. These four groups were the following: 1) No Tr, no Tregs were transferred; 2) Tr late, Tregs were transferred on day 28; 3) Tr early + depletion, Tregs were transferred on day −7 and depleted with anti-Thy1.1 mAb on day 28; 4) Tr early, Tregs were transferred on day −7. A, Representative flow cytometry dots plots show percentages of antigen-specific CD4 T cells (CD44highIAb2W1Stetramer+) and CD8 T cells (CD44highKbOVAtetramer+) in the left and middle panels, respectively. The right panels demonstrate Thy1.1 staining which marks adoptively transferred Tregs. The dot plots show samples from one representative experiment in which two animals per group were taken to enumerate the antigen-specific T cells by magnetic bead enrichment and FACS analysis. B, Enumeration of antigen-specific CD4 T cells (top panels) and CD8 T cells (bottom panels) from all individual experiments are shown in these graphs. The left panels show the total non-Treg CD4 (top) and CD8 (bottom) T cell numbers from the reconstituted RAG−/− animals and wild-type mice infected with the attenuated L. monocytogenes. The right panels show the numbers of antigen-specific CD4 (top) and CD8 (bottom) T cells. Statistical significance (p < 0.05) between indicated groups is marked with a horizontal bar.
FIGURE 7
FIGURE 7
Few Tregs are specific for IAb-2W1S. Adoptively transferred Tregs were identified by congenic marker Thy1.1 in the indicated experimental groups of reconstituted RAG−/− mice infected with the attenuated L. monocytogenes (top panel). IAb-2W1S-specific T cells were identified using magnetic bead enrichment and tetramer staining for flow cytometry.
FIGURE 8
FIGURE 8
The presence of Tregs during LIP allows enrichment of antigen-specific CD4 T cells capable of making IFN-γ following infection. Wild-type mice (right of each panel) or 30-day reconstituted TCRα−/− mice (left of each panel) were infected with the attenuated L. monocytogenes bacteria. IFN-γ production by IAb-2W1S-specific T cells was induced by injection of live L. monocytogenes bacteria 2–3 hours prior to tissue harvest. The left panel shows the number of total CD4 T cells, the middle panel shows the number of IAb-2W1S-specific CD4 T cells, and the right panel shows the number of IAb-2W1S-specific CD4 T cells producing IFN-γ. Each dot represents lymph node and spleen cells from two animals processed together for each of the two independent experiments.
FIGURE 9
FIGURE 9
Experimental protocol to test antigen-specific memory T cell responses. In phase I of the experiment two groups of RAG−/− mice were adoptively transferred naïve T cells: RAG−/− animals with or without pre-transfer of Thy1.2 Tregs. After 30 days of reconstitution these mice were infected with 107 attenuated L. monocytogenes bacteria. 10 days after infection the phase I animals were sacrificed and their Thy1.1 T cells were re-transferred into wild-type (Thy1.2/CD45.1 RAG+/+) mice, 3 × 10⁶ per recipient. The new recipients were then either infected with 107 attenuated L. monocytogenes bacteria or not. Magnetic bead enrichment and flow cytometric analysis was used to enumerate Thy1.1 (donor) and Thy1.2 (recipient) IAb-2W1S-specific T cells.
FIGURE 10
FIGURE 10
Antigen-specific memory T cells from reconstituted RAG−/− mice are detected only if Tregs were present during reconstitution. The figure shows the flow cytometric data from the experiment described in Figure 9. Thy1.1 T cells originate from the reconstituted RAG−/− animals and are now within the Thy1.2 wild-type secondary recipients. Antigen-specific CD4 T cells are identified with the IAb-2W1S tetramers. Numbers in bold print represent the absolute numbers of indicated cells. The regular print numbers in the lower right corners represent percentages within the indicated gates.

Similar articles

Cited by

References

    1. Jameson SC. T cell homeostasis: keeping useful T cells alive and live T cells useful. Semin Immunol. 2005;17:231–237. - PubMed
    1. Surh CD, Sprent J. Homeostasis of naive and memory T cells. Immunity. 2008;29:848–862. - PubMed
    1. Min B, McHugh R, Sempowski GD, Mackall C, Foucras G, Paul WE. Neonates support lymphopenia-induced proliferation. Immunity. 2003;18:131–140. - PubMed
    1. Khoruts A, Fraser JM. A causal link between lymphopenia and autoimmunity. Immunology letters. 2005;98:23–31. - PMC - PubMed
    1. Messaoudi I, Warner J, Nikolich-Zugich D, Fischer M, Nikolich-Zugich J. Molecular, Cellular, and Antigen Requirements for Development of Age-Associated T Cell Clonal Expansions In Vivo. J Immunol. 2006;176:301–308. - PubMed

Publication types

MeSH terms

Substances