

Estimated average glucose and self-monitored mean blood glucose are discordant estimates of glycemic control
- PMID: 20357368
- PMCID: PMC2890337
- DOI: 10.2337/dc09-1498
Estimated average glucose and self-monitored mean blood glucose are discordant estimates of glycemic control
Abstract
Objective: The A1C-Derived Average Glucose study recommended reporting A1C in estimated average glucose (eAG) equivalents. We compared eAG with self-monitored mean blood glucose (MBG) to determine whether eAG is systematically biased due to biological variation in the relationship between MBG and A1C.
Research design and methods: MBG and A1C were recorded from charts of 202 pediatric type 1 diabetic patients at 1,612 clinic visits. Patients were divided into groups with low, moderate, or high A1C bias based on a hemoglobin glycation index (HGI).
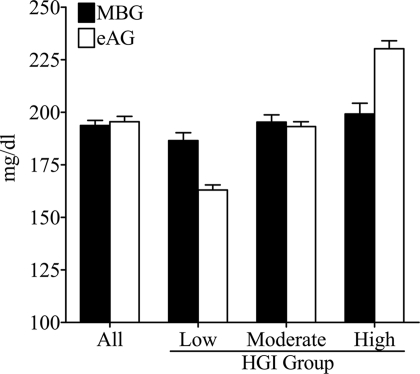
Results: The mean +/- SD values for MBG versus eAG were as follows: total population, 194 +/- 34 vs. 196 +/- 36 mg/dl; low-HGI group, 186 +/- 31 vs. 163 +/- 20 mg/dl; moderate-HGI group, 195 +/- 28 vs. 193 +/- 19 mg/dl; and high-HGI group, 199 +/- 42 vs. 230 +/- 31 mg/dl.
Conclusions: eAG underestimated MBG in low HGI patients and overestimated MBG in high HGI patients. Disagreement between eAG and MBG downloaded from patient glucose meters will cause confusion if eAG is implemented for clinical use.
Figures
Similar articles
-
Hemoglobin glycation index: a robust measure of hemoglobin A1c bias in pediatric type 1 diabetes patients.Pediatr Diabetes. 2010 Nov;11(7):455-61. doi: 10.1111/j.1399-5448.2009.00630.x. Pediatr Diabetes. 2010. PMID: 20088859
-
Clinically significant disagreement between mean blood glucose and estimated average glucose in two populations: implications for diabetes management.J Diabetes Sci Technol. 2009 Sep 1;3(5):1128-35. doi: 10.1177/193229680900300516. J Diabetes Sci Technol. 2009. PMID: 20144426 Free PMC article.
-
Correlation between self-monitored mean blood glucose and average plasma glucose estimated from glycated haemoglobin in patients attending the diabetes clinic at Dr George Mukhari Academic Hospital, Pretoria, South Africa.S Afr Med J. 2020 Apr 29;110(5):416-421. doi: 10.7196/SAMJ.2020.v110i5.13959. S Afr Med J. 2020. PMID: 32657728
-
Diabetic Kidney Disease: Is There a Role for Glycemic Variability?Curr Diab Rep. 2018 Feb 15;18(3):13. doi: 10.1007/s11892-018-0979-3. Curr Diab Rep. 2018. PMID: 29450720 Review.
-
How can we monitor glycaemic variability in the clinical setting?Diabetes Obes Metab. 2013 Sep;15 Suppl 2:13-6. doi: 10.1111/dom.12142. Diabetes Obes Metab. 2013. PMID: 24034515 Review.
Cited by
-
Hemoglobin A1c and Self-Monitored Average Glucose: Validation of the Dynamical Tracking eA1c Algorithm in Type 1 Diabetes.J Diabetes Sci Technol. 2015 Nov 9;10(2):330-5. doi: 10.1177/1932296815608870. J Diabetes Sci Technol. 2015. PMID: 26553023 Free PMC article.
-
Racial differences in neighborhood disadvantage, inflammation and metabolic control in black and white pediatric type 1 diabetes patients.Pediatr Diabetes. 2017 Mar;18(2):120-127. doi: 10.1111/pedi.12361. Epub 2016 Jan 18. Pediatr Diabetes. 2017. PMID: 26783014 Free PMC article.
-
Haemoglobin glycation index and risk for diabetes-related complications in the Action in Diabetes and Vascular Disease: Preterax and Diamicron Modified Release Controlled Evaluation (ADVANCE) trial.Diabetologia. 2018 Apr;61(4):780-789. doi: 10.1007/s00125-017-4539-1. Epub 2018 Jan 8. Diabetologia. 2018. PMID: 29308539 Free PMC article. Clinical Trial.
-
Explaining the increased mortality in type 1 diabetes.World J Diabetes. 2015 Jul 10;6(7):889-95. doi: 10.4239/wjd.v6.i7.889. World J Diabetes. 2015. PMID: 26185597 Free PMC article.
-
Association between hemoglobin glycation index with insulin resistance and carotid atherosclerosis in non-diabetic individuals.PLoS One. 2017 Apr 20;12(4):e0175547. doi: 10.1371/journal.pone.0175547. eCollection 2017. PLoS One. 2017. PMID: 28426788 Free PMC article.
References
-
- Chalew S, Hempe JM: Caveats regarding the use of HbA1c for prediction of mean blood glucose. Diabetologia 2008; 51: 903–904 - PubMed
-
- Kilpatrick ES, Rigby AS, Atkin SL: Variability in the relationship between mean plasma glucose and HbA1c: implications for the assessment of glycemic control. Clin Chem 2007; 53: 897–901 - PubMed
-
- Bloomgarden ZT, Inzucchi SE, Karnieli E, Le Roith D: The proposed terminology 'A(1c)-derived average glucose' is inherently imprecise and should not be adopted. Diabetologia 2008; 51: 1111–1114 - PubMed
Publication types
MeSH terms
Substances
LinkOut - more resources
Full Text Sources
Medical
