

Genetic modulation of GABA levels in the anterior cingulate cortex by GAD1 and COMT
- PMID: 20357758
- PMCID: PMC2891897
- DOI: 10.1038/npp.2010.35
Genetic modulation of GABA levels in the anterior cingulate cortex by GAD1 and COMT
Abstract
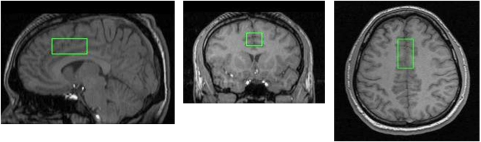
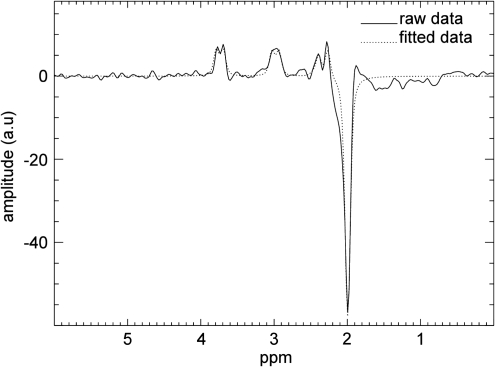
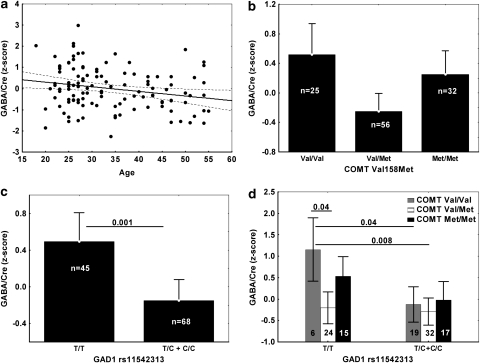
Gamma-aminobutyric acid (GABA)-ergic transmission is critical for normal cortical function and is likely abnormal in a variety of neuropsychiatric disorders. We tested the in vivo effects of variations in two genes implicated in GABA function on GABA concentrations in prefrontal cortex of living subjects: glutamic acid decarboxylase 1 (GAD1), which encodes GAD67, and catechol-o-methyltransferase (COMT), which regulates synaptic dopamine in the cortex. We studied six single nucleotide polymorphisms (SNPs) in GAD1 previously associated with risk for schizophrenia or cognitive dysfunction and the val158met polymorphism in COMT in 116 healthy volunteers using proton magnetic resonance spectroscopy. Two of the GAD1 SNPs (rs1978340 (p=0.005) and rs769390 (p=0.004)) showed effects on GABA levels as did COMT val158met (p=0.04). We then tested three SNPs in GAD1 (rs1978340, rs11542313, and rs769390) for interaction with COMT val158met based on previous clinical results. In this model, rs11542313 and COMT val158met showed significant main effects (p=0.001 and 0.003, respectively) and a trend toward a significant interaction (p=0.05). Interestingly, GAD1 risk alleles for schizophrenia were associated with higher GABA/Cre, and Val-Val homozygotes had high GABA/Cre levels when on a GAD1 risk genotype background (N=6). These results support the importance of genetic variation in GAD1 and COMT in regulating prefrontal cortical GABA function. The directionality of the effects, however, is inconsistent with earlier evidence of decreased GABA activity in schizophrenia.
Figures


Similar articles
-
Genetic variation in GAD1 is associated with cortical thickness in the parahippocampal gyrus.J Psychiatr Res. 2013 Jul;47(7):872-9. doi: 10.1016/j.jpsychires.2013.03.010. Epub 2013 Apr 6. J Psychiatr Res. 2013. PMID: 23566421 Free PMC article.
-
Allelic variation in GAD1 (GAD67) is associated with schizophrenia and influences cortical function and gene expression.Mol Psychiatry. 2007 Sep;12(9):854-69. doi: 10.1038/sj.mp.4001988. Epub 2007 May 1. Mol Psychiatry. 2007. PMID: 17767149
-
COMT val158met polymorphism and molecular alterations in the human dorsolateral prefrontal cortex: Differences in controls and in schizophrenia.Schizophr Res. 2016 May;173(1-2):94-100. doi: 10.1016/j.schres.2016.03.019. Epub 2016 Mar 24. Schizophr Res. 2016. PMID: 27021555 Free PMC article.
-
Catechol-O-methyltransferase gene Val158Met polymorphism and obsessive compulsive disorder susceptibility: a meta-analysis.Metab Brain Dis. 2020 Feb;35(2):241-251. doi: 10.1007/s11011-019-00495-0. Epub 2019 Dec 26. Metab Brain Dis. 2020. PMID: 31879835 Review.
-
Treatment of cognitive deficits associated with schizophrenia: potential role of catechol-O-methyltransferase inhibitors.CNS Drugs. 2007;21(7):535-57. doi: 10.2165/00023210-200721070-00002. CNS Drugs. 2007. PMID: 17579498 Review.
Cited by
-
Interacting Roles of COMT and GAD1 Genes in Patients with Treatment-Resistant Schizophrenia: a Genetic Association Study of Schizophrenia Patients and Healthy Controls.J Mol Neurosci. 2021 Dec;71(12):2575-2582. doi: 10.1007/s12031-021-01866-y. Epub 2021 Jun 14. J Mol Neurosci. 2021. PMID: 34125398
-
Edited magnetic resonance spectroscopy detects an age-related decline in brain GABA levels.Neuroimage. 2013 Sep;78:75-82. doi: 10.1016/j.neuroimage.2013.04.012. Epub 2013 Apr 13. Neuroimage. 2013. PMID: 23587685 Free PMC article.
-
The relation between parietal GABA concentration and numerical skills.Sci Rep. 2021 Sep 3;11(1):17656. doi: 10.1038/s41598-021-95370-3. Sci Rep. 2021. PMID: 34480033 Free PMC article.
-
Novel pharmacological targets for GABAergic dysfunction in ADHD.Neuropharmacology. 2024 May 15;249:109897. doi: 10.1016/j.neuropharm.2024.109897. Epub 2024 Mar 8. Neuropharmacology. 2024. PMID: 38462041 Free PMC article. Review.
-
Reduced GABA concentration in attention-deficit/hyperactivity disorder.Arch Gen Psychiatry. 2012 Jul;69(7):750-3. doi: 10.1001/archgenpsychiatry.2011.2280. Arch Gen Psychiatry. 2012. PMID: 22752239 Free PMC article.
References
-
- Addington AM, Gornick M, Duckworth J, Sporn A, Gogtay N, Bobb A, et al. GAD1 (2q31.1), which encodes glutamic acid decarboxylase (GAD67), is associated with childhood-onset schizophrenia and cortical gray matter volume loss. Mol Psychiatry. 2005;10:581–588. - PubMed
-
- Akbarian S, Huang HS. Molecular and cellular mechanisms of altered GAD1/GAD67 expression in schizophrenia and related disorders. Brain Res Rev. 2006;52:293–304. - PubMed
Publication types
MeSH terms
Substances
Grants and funding
LinkOut - more resources
Full Text Sources
Miscellaneous
