

From evidence to inference: probing the evolution of protein interaction networks
- PMID: 20357887
- PMCID: PMC2801530
- DOI: 10.2976/1.3167215
From evidence to inference: probing the evolution of protein interaction networks
Abstract
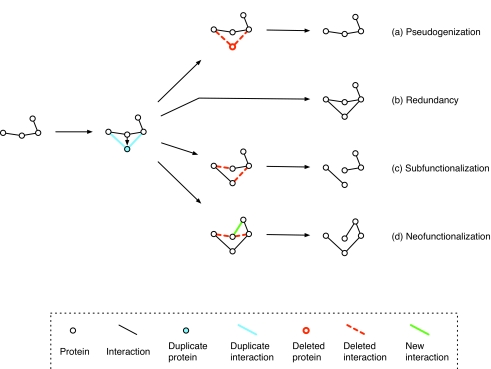
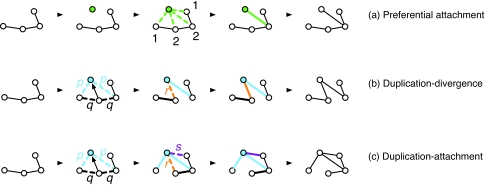
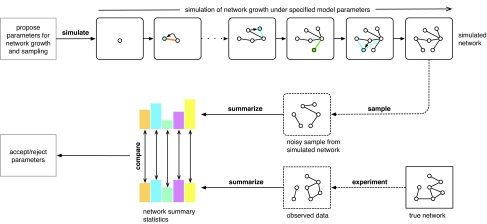
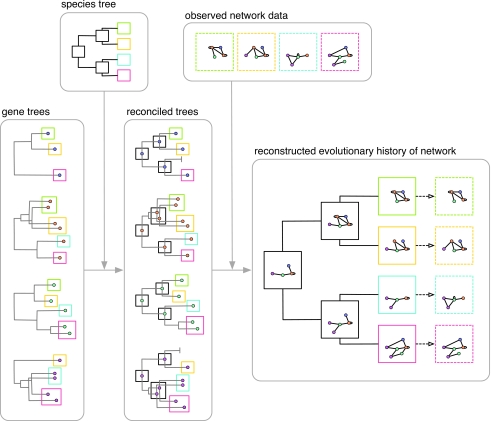
The evolutionary mechanisms by which protein interaction networks grow and change are beginning to be appreciated as a major factor shaping their present-day structures and properties. Starting with a consideration of the biases and errors inherent in our current views of these networks, we discuss the dangers of constructing evolutionary arguments from naïve analyses of network topology. We argue that progress in understanding the processes of network evolution is only possible when hypotheses are formulated as plausible evolutionary models and compared against the observed data within the framework of probabilistic modeling. The value of such models is expected to be greatly enhanced as they incorporate more of the details of the biophysical properties of interacting proteins, gene phylogeny, and measurement error and as more advanced methodologies emerge for model comparison and the inference of ancestral network states.
Figures
Similar articles
-
Functional and evolutionary inference in gene networks: does topology matter?Genetica. 2007 Jan;129(1):83-103. doi: 10.1007/s10709-006-0035-0. Epub 2006 Aug 8. Genetica. 2007. PMID: 16897451
-
Using likelihood-free inference to compare evolutionary dynamics of the protein networks of H. pylori and P. falciparum.PLoS Comput Biol. 2007 Nov;3(11):e230. doi: 10.1371/journal.pcbi.0030230. Epub 2007 Oct 9. PLoS Comput Biol. 2007. PMID: 18052538 Free PMC article.
-
Ancestral inference and the study of codon bias evolution: implications for molecular evolutionary analyses of the Drosophila melanogaster subgroup.PLoS One. 2007 Oct 24;2(10):e1065. doi: 10.1371/journal.pone.0001065. PLoS One. 2007. PMID: 17957249 Free PMC article.
-
Inference of gene regulatory networks using boolean-network inference methods.J Bioinform Comput Biol. 2009 Dec;7(6):1013-29. doi: 10.1142/s0219720009004448. J Bioinform Comput Biol. 2009. PMID: 20014476 Review.
-
Evaluating network inference methods in terms of their ability to preserve the topology and complexity of genetic networks.Semin Cell Dev Biol. 2016 Mar;51:44-52. doi: 10.1016/j.semcdb.2016.01.012. Epub 2016 Feb 3. Semin Cell Dev Biol. 2016. PMID: 26851626 Review.
Cited by
-
Comparison of large networks with sub-sampling strategies.Sci Rep. 2016 Jul 6;6:28955. doi: 10.1038/srep28955. Sci Rep. 2016. PMID: 27380992 Free PMC article.
-
Dominating biological networks.PLoS One. 2011;6(8):e23016. doi: 10.1371/journal.pone.0023016. Epub 2011 Aug 26. PLoS One. 2011. PMID: 21887225 Free PMC article.
-
Alignment-free protein interaction network comparison.Bioinformatics. 2014 Sep 1;30(17):i430-7. doi: 10.1093/bioinformatics/btu447. Bioinformatics. 2014. PMID: 25161230 Free PMC article.
-
Protein-Protein Interactions in Virus-Host Systems.Front Microbiol. 2017 Aug 17;8:1557. doi: 10.3389/fmicb.2017.01557. eCollection 2017. Front Microbiol. 2017. PMID: 28861068 Free PMC article. Review.
-
Limitations of gene duplication models: evolution of modules in protein interaction networks.PLoS One. 2012;7(4):e35531. doi: 10.1371/journal.pone.0035531. Epub 2012 Apr 18. PLoS One. 2012. PMID: 22530042 Free PMC article.
References
LinkOut - more resources
Full Text Sources