. 2009 Oct;3(5):350-66.
doi: 10.2976/1.3218766. Epub 2009 Oct 22.

Integrating ELF4 into the circadian system through combined structural and functional studies

Integrating ELF4 into the circadian system through combined structural and functional studies

Elsebeth Kolmos et al. HFSP J. 2009 Oct.

Abstract

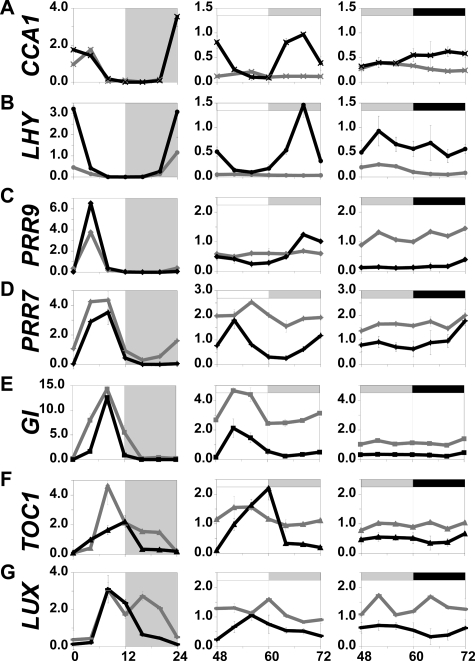
The circadian clock is a timekeeping mechanism that enables anticipation of daily environmental changes. In the plant Arabidopsis thaliana, the circadian system is a multiloop series of interlocked transcription-translation feedbacks. Several genes have been arranged in these oscillation loops, but the position of the core-clock gene ELF4 in this network was previously undetermined. ELF4 lacks sequence similarity to known domains, and functional homologs have not yet been identified. Here we show that ELF4 is functionally conserved within a subclade of related sequences, and forms an alpha-helical homodimer with a likely electrostatic interface that could be structurally modeled. We support this hypothesis by expression analysis of new elf4 hypomorphic alleles. These weak mutants were found to have expression level phenotypes of both morning and evening clock genes, implicating multiple entry points of ELF4 within the multiloop network. This could be mathematically modeled. Furthermore, morning-expression defects were particular to some elf4 alleles, suggesting predominant ELF4 action just preceding dawn. We provide a new hypothesis about ELF4 in the oscillator-it acts as a homodimer to integrate two arms of the circadian clock.


Figures

Figure 1
Figure 1. ELF4 phylogeny
. ELF4 Bayesian consensus tree. Majority-rule consensus of 3601 trees (burn-in=402 trees) from two runs of 2 million generations each. Bayesian posterior probabilities indicated support for individual nodes are above the branches as percentages. The ELF4∕EFL1 clade is shaded in gray.
Figure 2
Figure 2. ELF4 self-associates to form a homodimer
. The molecular mass of the ELF4 was empirically determined. The ELF4 dimer was subsequently predicted. (A) Purified ELF4 protein migrates with a size of ∼26 kDa after blue native-polyacrylamide gel electrophoresis (BN-PAGE). The bands were visualized after Coomassie staining. Standards: A, albumin (67 kDa); C, chymotrypsinogen A (25 kDa); O, ovoalbumin (43 kDa); R, ribonuclease A (13.7 kDa). (B) Gel filtration of purified recombinant ELF4. Standards as in (A). Note that ELF4 elutes exclusively as a single peak between the 13.7 kDa and 43 kDa standards, indicating a tight homodimer. (C) CD spectrum of purified ELF4 confirms that the native fold of ELF4 is mainly α-helical, as indicated by the two negative peaks around 222 nm and 205 nm. (D) ELF4 dimer model. ELF4 self-associates with a dimer interface along the α-helical fold. Side view (top) and end-on view (bottom) of the proposed ELF4 dimer. The two ELF4 monomers are colored yellow-red and blue-green, respectively.
Figure 3
Figure 3. EFL complementation assay
. ELF4 circadian function is not conserved within all members of the DUF1313 fold. Seedlings harboring CCA1:LUC were entrained under 12L:12D cycles and released into LL. Lines are indicated by the identity of the insert. ELF4, ELF4p:ELF4 positive control; Neg, negative control. See also Methods. Precision of rhythms were defined and measured as number of rhythmic seedlings with relative amplitude error (RAE)<0.5, as also listed in Table S1 (see Supplementary Material). Identity of sequences, as in Fig. 1. (A) CCA1:LUC profiles. Shaded boxes indicate subjective night. (B) Result of period analysis of profiles shown in (A); precision of population vs average period length. Error bars represent SD of two independent experiments.
Figure 4
Figure 4. Clock gene expression in
. mRNA accumulation in elf4-207 from (left panel) day seven under an LD cycle; (middle panel) the third day under LL; or (right panel) the third day in DD. The expression level is relative to TUBULIN2 (TUB2) and normalized to the average diurnal expression level in Col-0. Gray box indicates night-time for LD profiles, or subjective night or day in LL or DD assays. Gray and black curves represent elf4-207 and Col-0, respectively. The Y-axes represent normalized gene expression and the X-axes are Time (hours). [(A) and (B)] Strongly attenuated expression of CCA1 and LHY in elf4-207. (C) PRR9. LL average: elf4-207, 0.60; Col-0, 0.60; P=0.98. DD average: elf4-207, 1.18; Col-0, 0.18; P=1.4×10⁻⁶. (D) PRR7. LL average: elf4-207, 1.97; Col-0, 0.82; P=0.0006. DD average: elf4-207, 1.63; Col-0, 0.95; P=0.002. (E) GI. LL average: elf4-207, 3.21; Col-0, 0.77; P=0.0002. DD average: elf4-207, 1.14; Col-0, 0.34; P=9.5×10⁻⁷. (F) TOC1. LL average: elf4-207, 1.21; Col-0, 0.82; P=0.27. DD average: elf4-207, 0.94; Col-0, 0.50; P=5.6×10⁻⁶. (G) LUX. LL average: elf4-207, 1.16; Col-0, 0.60; P=0.002. DD average: elf4-207, 1.34; Col-0, 0.56; P=8.2×10⁻⁵.
Figure 5
Figure 5. Mathematical modeling the circadian output of
. Numerical simulation of the expression level of TOC1 and LHY in PRR9-ox, Y-ox, and the double overexpression line, PRR9-oxY-ox, compared to wild type, under one LD cycle and into LL. PRR9 represents a compound activity of both PRR9 and PRR7, and Y here was taken as GI, as in the three-loop model. The simulations were performed using the three-loop model. (A) The expression level of TOC1 dampens high and becomes arrhythmic only following the overexpression of both PRR9 and Y. (B) Overexpression of both PRR9 and Y results in elimination of the LHY expression. Note that LHY was found at the base-line in the PRR90ox and PRR9-oxY-ox models.
Figure 6
Figure 6. Morning-clock gene profiles in some elf4 alleles
. Clock transcript accumulation in elf4-203, elf4-212, elf4-210 (all in respective gray), and Col-0 (black) under the third day under LL (lower panel), or the third day in DD (upper panel). Normalized data and Col-0 data as in Fig. 4. The Y-axes represent normalized gene expression and the X-axes are time (hours). (A) CCA1; (B) LHY; (C) PRR9. Mean expression values as follows. elf4-203: LL, 0.89; DD, 0.29; P=0.03. elf4-212: LL, 0.49; DD, 0.44; P=0.75. elf4-210: LL, 0.88; DD, 0.78; P=0.52. Col-0: LL, 0.60; DD, 0.18; P=0.03. (D) PRR7. Arrowheads indicate the derepression phenotype in elf4-210 (LL, 0.78; DD, 1.43; P=0.008).
Figure 7
Figure 7. Evening-clock gene profiles in some elf4 alleles
. Clock transcript accumulation in elf4-203, elf4-212, elf4-210 (all in respective gray), and Col-0 (black) under the third day under LL (lower panel), or the third day in DD (upper panel). Normalized data and Col-0 data, as in Fig. 4. (A) GI; (B) TOC1; and (C) LUX. The Y-axes represent normalized gene expression and the X-axes are time (hours).
Figure 8
Figure 8. Integrated models of ELF4 at a structural and functional level
. (A) The strong missense alleles of ELF4 are predicted to affect charge distribution on the ELF4 structure. The distribution of charged residues surrounding the proposed ELF4 dimer are “opposite” in such a way that only one side of the dimer is positively charged and vice versa. Blue color depicts positive charged surface and red depicts negatively charge surface. Note that the ELF4 dimer has a polar ionic distribution. (B) Position of the residues affected in elf4-203 (R31), elf4-210 (R31), elf4-204 (R34), and elf4-212 (A59) on the surface model. (C) ELF4 dimer, side view. The globally conserved residues are colored in blue. Red residues are the amino acids that are conserved in the ELF4 subgroup (see also Supplementary Material, Fig. S1). R31, R34, and A59 described in (B) are highlighted in green. (D) ELF4 dimer, end view. Colors as in (C). (E) Summary of all expression data from Figs. 467 and Supplementary Material, Figs. S6 and S7. The coloring represents gene expression (mean level) that is not changed (black), increased (red), or decreased (green) as compared between conditions (LL and DD) within a given genotype. (F) A genetic model of ELF4 in the three-loop model of the circadian system. ELF4 repress both PRR9PRR7 (the morning loop) and GI in the evening loop. Red arrows indicate points of light input.

References

    1. Alabadi, D, Oyama, T, Yanovsky, M J, Harmon, F G, Mas, P, and Kay, S A (2001). “Reciprocal regulation between TOC1 and LHY∕CCA1 within the Arabidopsis circadian clock.” Science SCIEAS 293, 880–883.10.1126/science.1061320 - DOI - PubMed
    1. Alabadi, D, Yanovsky, M J, Mas, P, Harmer, S L, and Kay, S A (2002). “Critical role for CCA1 and LHY in maintaining circadian rhythmicity in Arabidopsis.” Curr. Biol. CUBLE2 12, 757–761.10.1016/S0960-9822(02)00815-1 - DOI - PubMed
    1. Allen, T, Koustenis, A, Theodorou, G, Somers, D E, Kay, S A, Whitelam, G C, and Devlin, P F (2006). “Arabidopsis FHY3 specifically gates phytochrome signaling to the circadian clock.” Plant Cell PLCEEW 18, 2506–2516.10.1105/tpc.105.037358 - DOI - PMC - PubMed
    1. Altschul, S F, Gish, W, Miller, W, Myers, E W, and Lipman, D J (1990). “Basic local alignment search tool.” J. Mol. Biol. JMOBAK 215, 403–410. - PubMed
    1. Bao, X, Franks, R G, Levin, J Z, and Liu, Z (2004). “Repression of AGAMOUS by BELLRINGER in floral and inflorescence meristems.” Plant Cell PLCEEW 16, 1478–1489.10.1105/tpc.021147 - DOI - PMC - PubMed