

doi: 10.1021/jp9085969.
Carbon Dots as Nontoxic and High-Performance Fluorescence Imaging Agents
Affiliations
- PMID: 20357893
- PMCID: PMC2846368
- DOI: 10.1021/jp9085969
Item in Clipboard
Carbon Dots as Nontoxic and High-Performance Fluorescence Imaging Agents
J Phys Chem C Nanomater Interfaces.
.
Abstract
Fluorescent carbon dots (small carbon nanoparticles with the surface passivated by oligomeric PEG molecules) were evaluated for their cytotoxicity and in vivo toxicity and also for their optical imaging performance in reference to that of the commercially supplied CdSe/ZnS quantum dots. The results suggested that the carbon dots were biocompatible, and their performance as fluorescence imaging agents was competitive. The implication to the use of carbon dots for in vitro and in vivo applications is discussed.
Figures
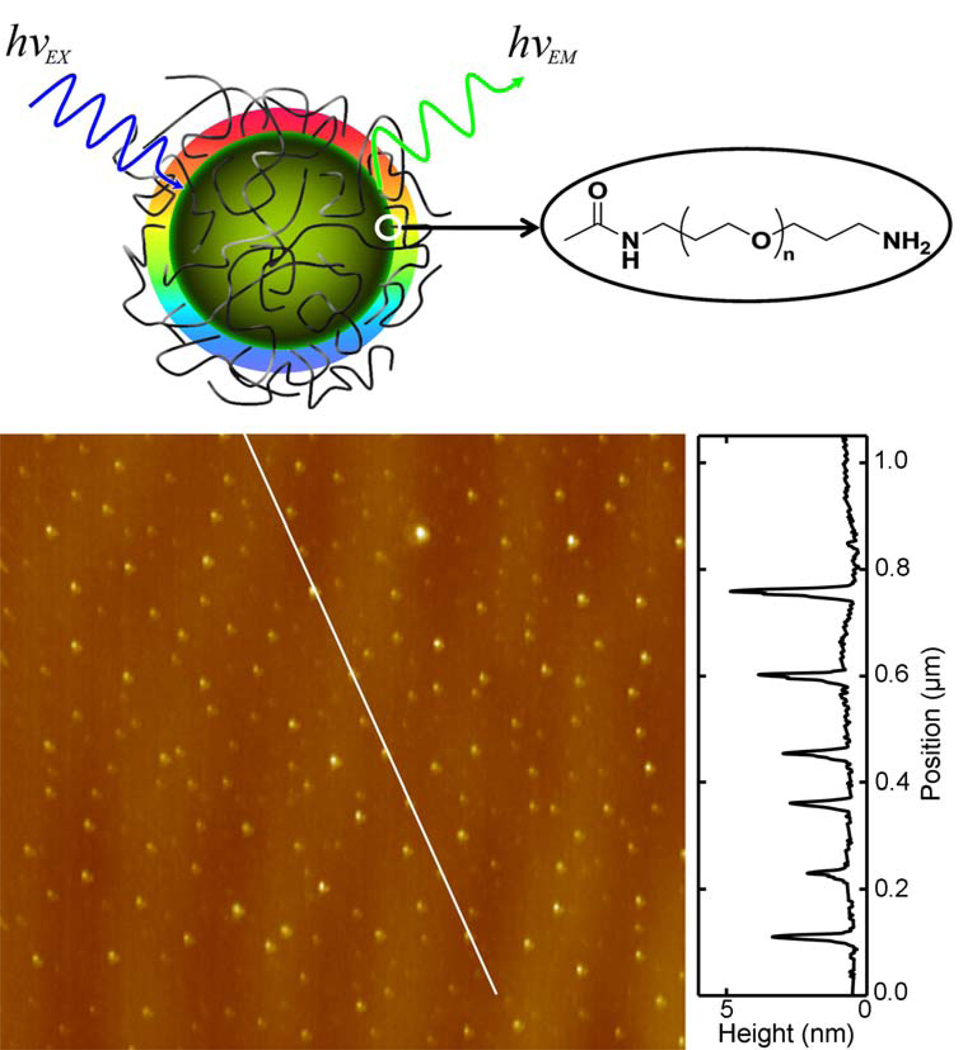
Top: A cartoon illustration of C-Dots. Bottom: A representative AFM topography image of C-Dots on mica (with a height profile plot along the line).
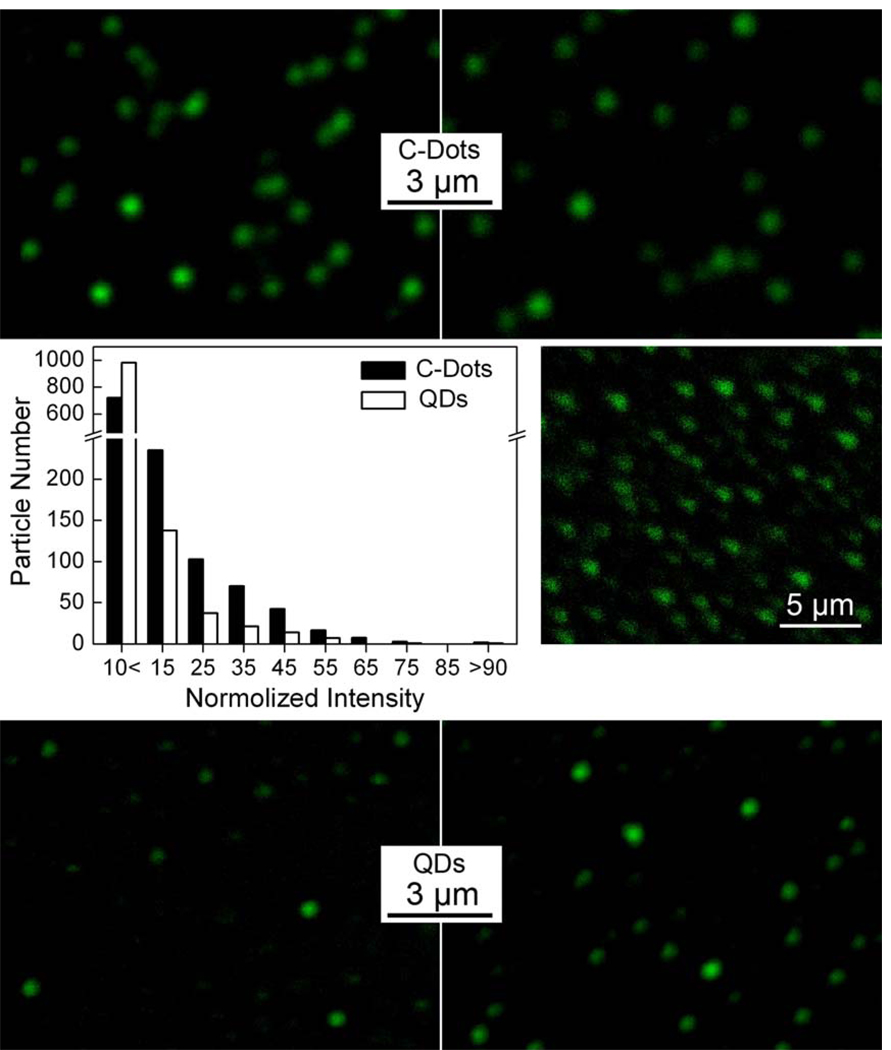
Fluorescence images (argon ion laser excitation at 458 nm) of C-Dots (top) and the commercially supplied CdSe/ZnS QDs (bottom) in specimens from infinite dilution, with analyses (by ImageJ software) of large numbers of dots (in multiple images) for their relative fluorescence intensities (middle left). The corresponding two-photon (femtosecond pulsed laser excitation at 880 nm) fluorescence image of the C-Dots specimen is also shown for comparison (middle right).
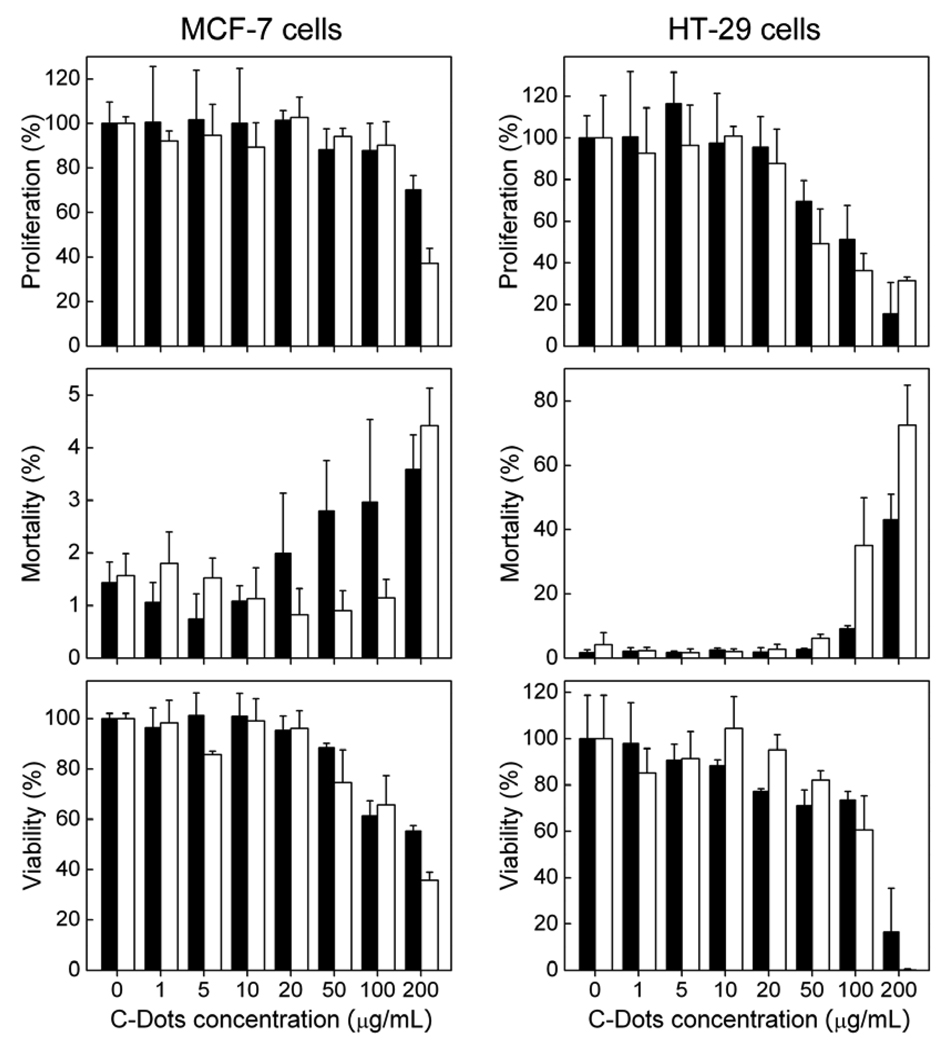
Results from cytotoxicity evaluations of C-Dots (black) and PEG1500N (white). Data presented as mean ± SD (n=4).
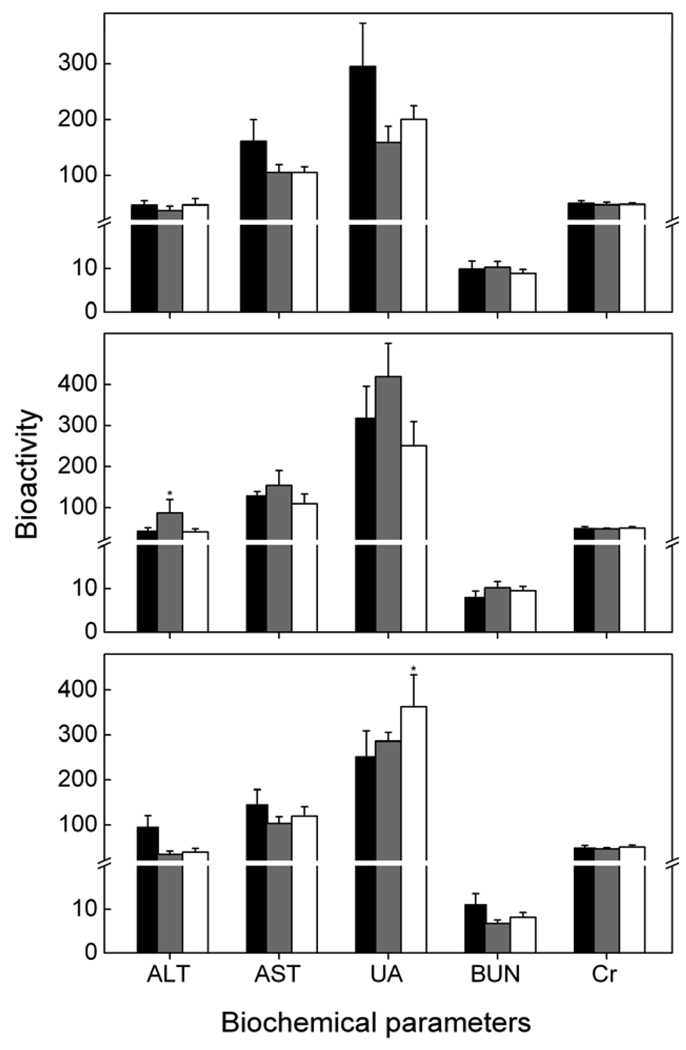
Serum biochemistry results for mice intravenously exposed to C-Dots at carbon core-equivalent of 8 mg/kg (grey) and 40 mg/kg (white) and the control mice (black) at 1 day (top), 7 days (middle), and 28 days (bottom) post-exposure. Data presented as mean ± SD (n=5).
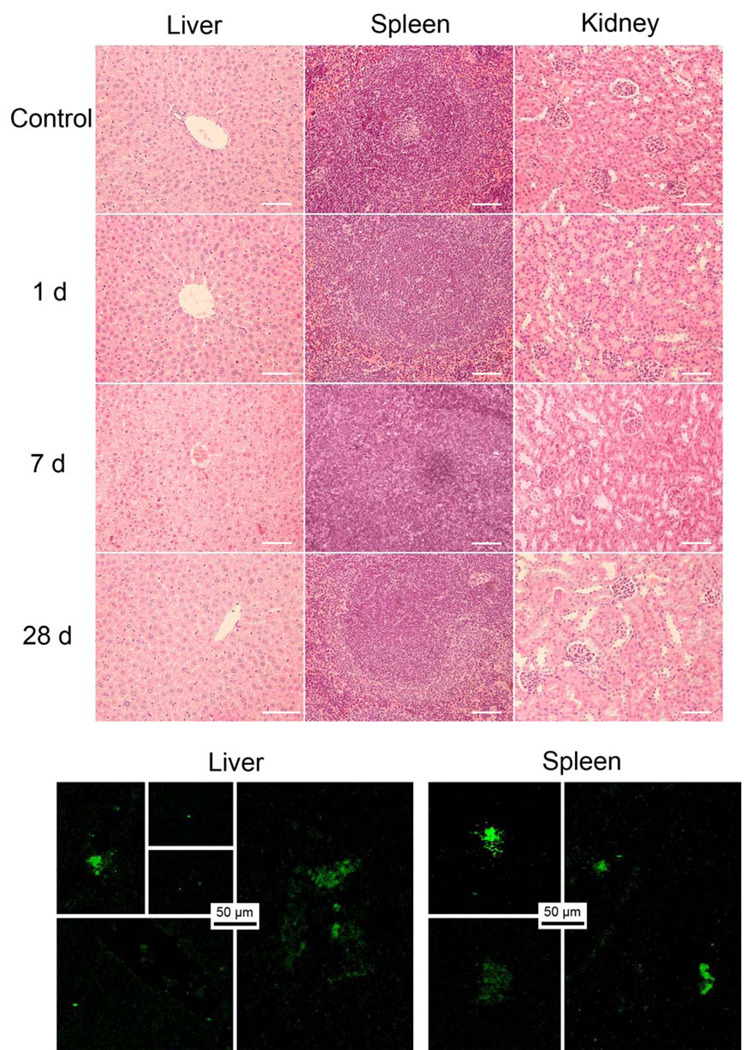
Top: Results from histopathological analyses of liver, spleen, and kidneys. Bottom: Fluorescence images (two-photon excitation at 800 nm) of sliced liver and spleen harvested from mice 6 h after intravenous exposure to C-Dots.
References
Grants and funding
LinkOut - more resources
Full Text Sources
Other Literature Sources