

O Labeling for a Quantitative Proteomic Analysis of Glycoproteins in Hepatocellular Carcinoma
- PMID: 20357908
- PMCID: PMC2847390
- DOI: 10.1007/s12014-008-9013-0
O Labeling for a Quantitative Proteomic Analysis of Glycoproteins in Hepatocellular Carcinoma
Abstract
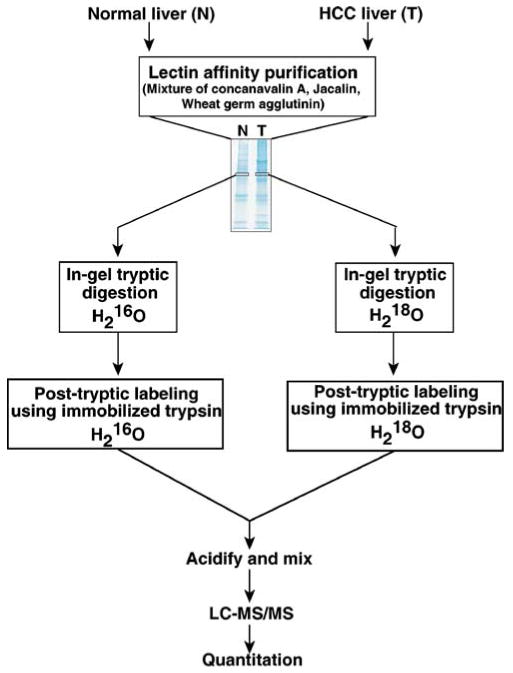
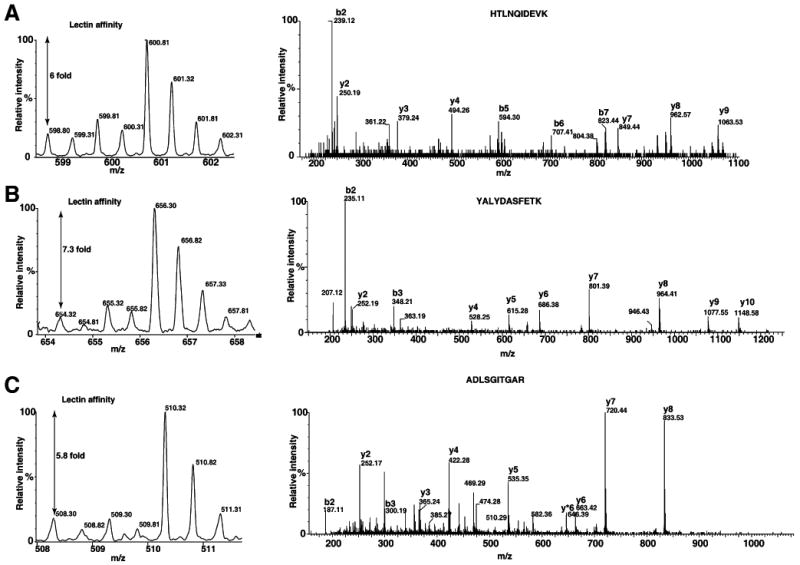
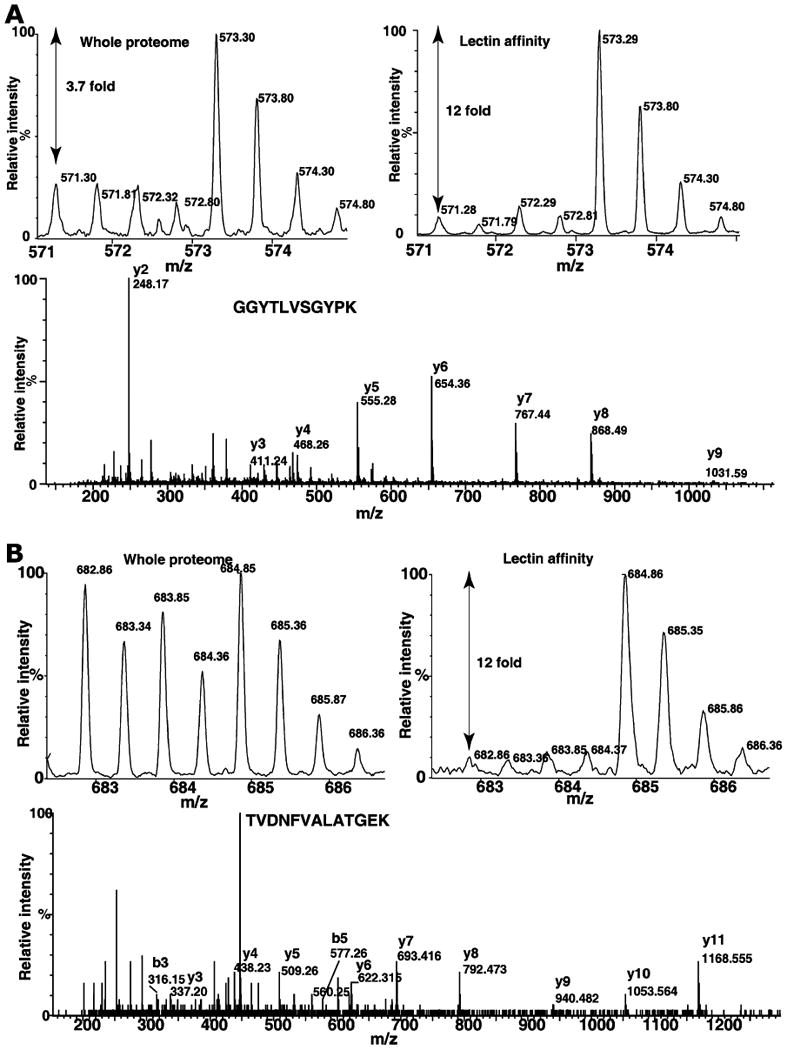
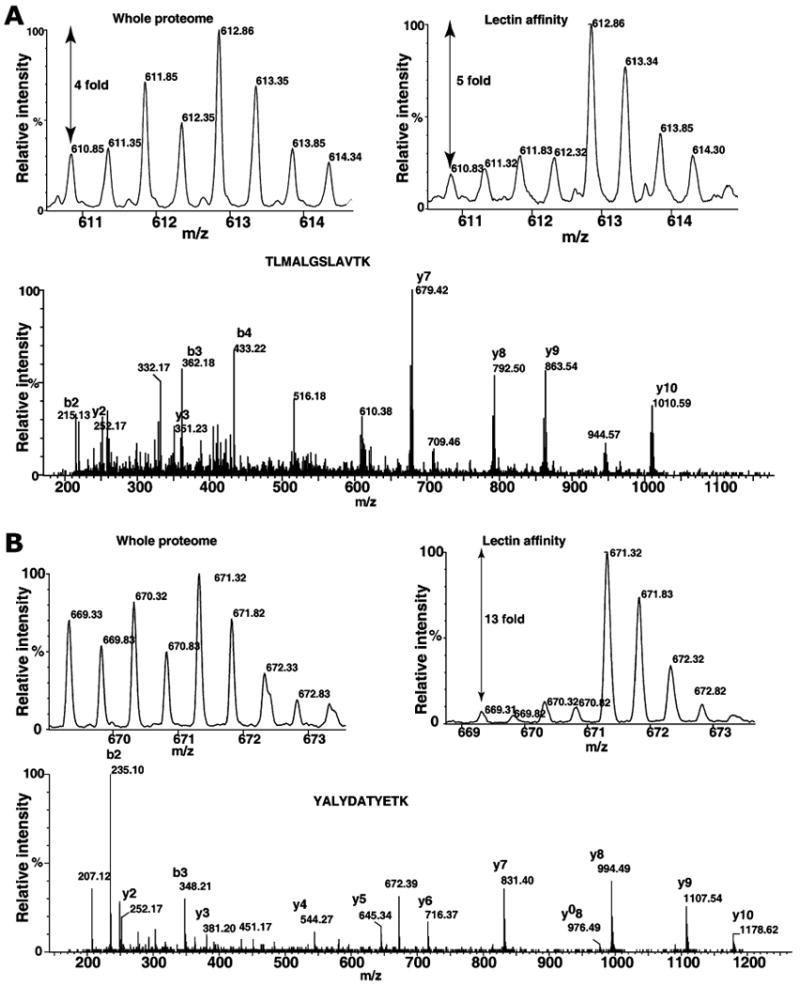
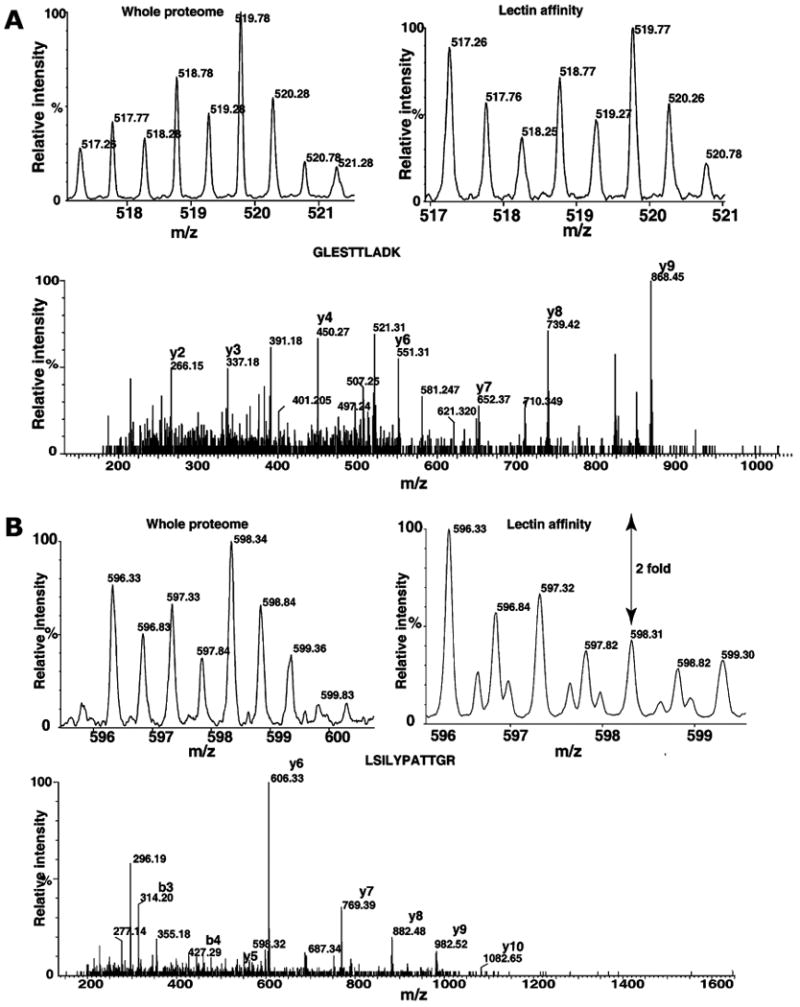
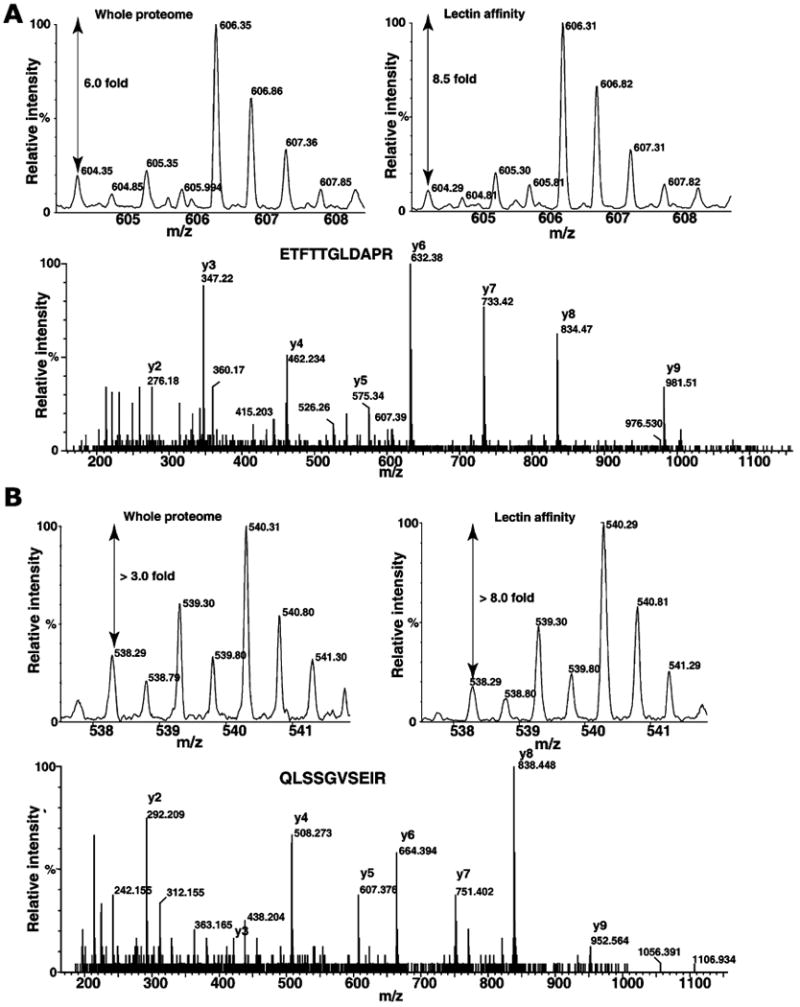
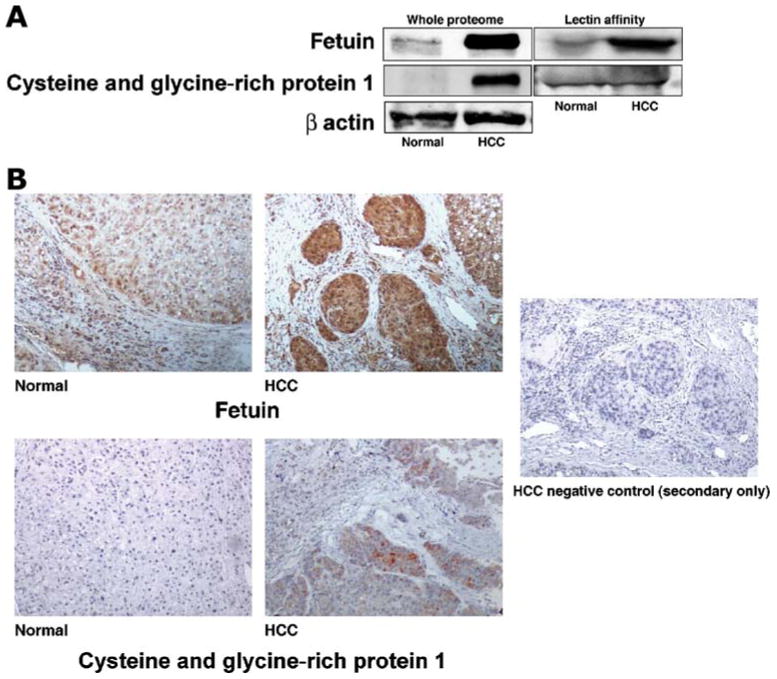
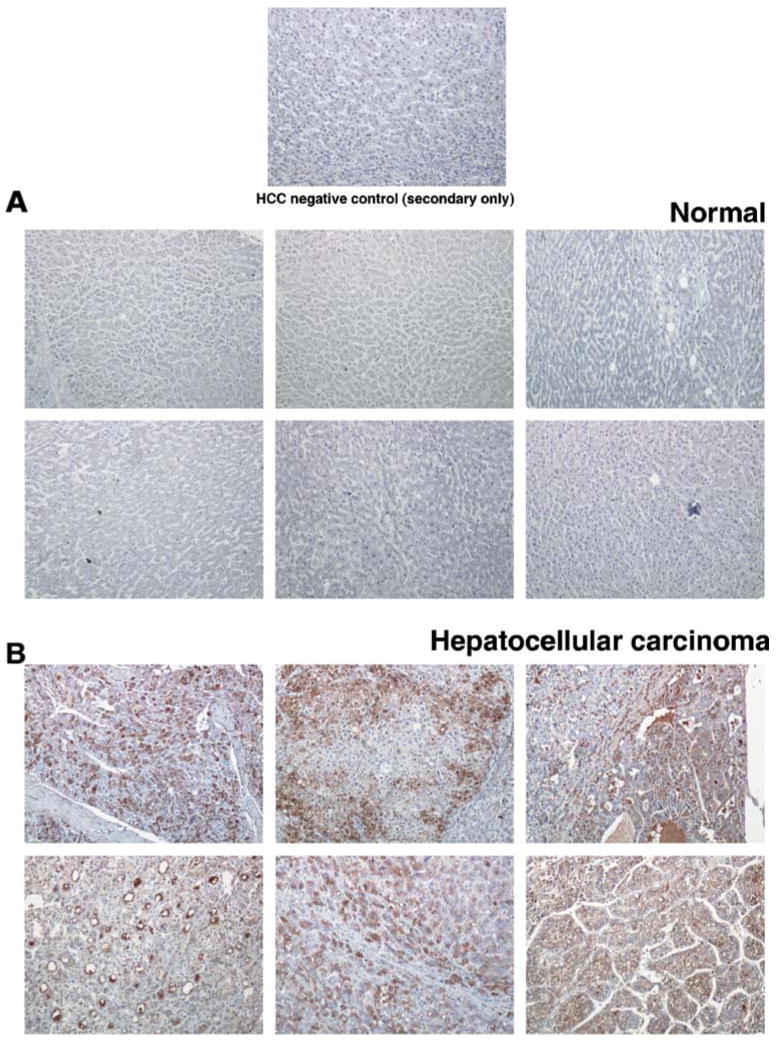
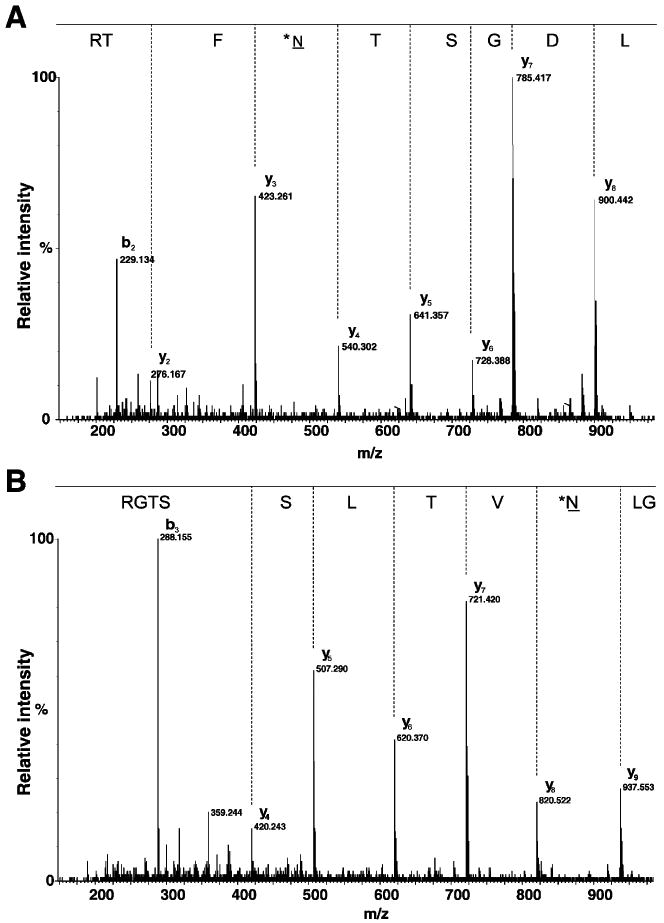
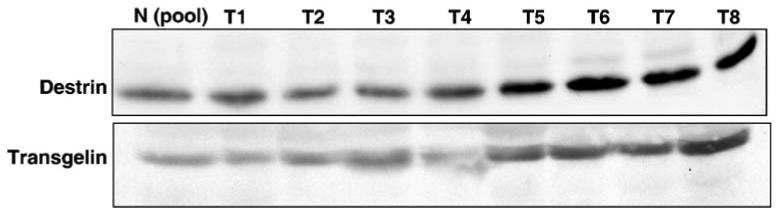
INTRODUCTION: Quantitative proteomics using tandem mass spectrometry is an attractive approach for identification of potential cancer biomarkers. Fractionation of complex tissue samples into subproteomes prior to mass spectrometric analyses increases the likelihood of identifying cancer-specific proteins that might be present in low abundance. In this regard, glycosylated proteins are an interesting class of proteins that are already established as biomarkers for several cancers. MATERIALS AND METHODS: In this study, we carried out proteomic profiling of tumor and adjacent non-cancer liver tissues from hepatocellular carcinoma (HCC) patients. Glycoprotein enrichment from liver samples using lectin affinity chromatography and subsequent (18)O/(16)O labeling of peptides allowed us to obtain relative abundance levels of lectin-bound proteins. As a complementary approach, we also examined the relative expression of proteins in HCC without glycoprotein enrichment. Lectin affinity enrichment was found to be advantageous to quantitate several interesting proteins, which were not detected in the whole proteome screening approach. We identified and quantitated over 200 proteins from the lectin-based approach. Interesting among these were fetuin, cysteine-rich protein 1, serpin peptidase inhibitor, leucine-rich alpha-2-glycoprotein 1, melanoma cell adhesion molecule, and heparan sulfate proteoglycan-2. Using lectin affinity followed by PNGase F digestion coupled to (18)O labeling, we identified 34 glycosylation sites with consensus sequence N-X-T/S. Western blotting and immunohistochemical staining were carried out for several proteins to confirm mass spectrometry results. CONCLUSION: This study indicates that quantitative proteomic profiling of tumor tissue versus non-cancerous tissue is a promising approach for the identification of potential biomarkers for HCC.
Figures
Similar articles
-
Differential proteomic approach for identification and verification of aberrantly glycosylated proteins in adenocarcinoma lung cancer (ADLC) plasmas by lectin-capturing and targeted mass spectrometry.J Proteomics. 2014 Jun 25;106:221-9. doi: 10.1016/j.jprot.2014.04.031. Epub 2014 Apr 26. J Proteomics. 2014. PMID: 24780727
-
Quantitative proteomic analysis for high-throughput screening of differential glycoproteins in hepatocellular carcinoma serum.Cancer Biol Med. 2015 Sep;12(3):246-54. doi: 10.7497/j.issn.2095-3941.2015.0010. Cancer Biol Med. 2015. PMID: 26487969 Free PMC article.
-
[Comparison of the performance of secretome analysis based on metabolic labeling by three unnatural sugars].Se Pu. 2021 Oct;39(10):1086-1093. doi: 10.3724/SP.J.1123.2021.04017. Se Pu. 2021. PMID: 34505430 Free PMC article. Chinese.
-
Glycoproteomic markers of hepatocellular carcinoma-mass spectrometry based approaches.Mass Spectrom Rev. 2019 May;38(3):265-290. doi: 10.1002/mas.21583. Epub 2018 Nov 25. Mass Spectrom Rev. 2019. PMID: 30472795 Free PMC article. Review.
-
Lectin-based glycoproteomics to explore and analyze hepatocellular carcinoma-related glycoprotein markers.Electrophoresis. 2009 Sep;30(17):2957-2966. doi: 10.1002/elps.200900064. Electrophoresis. 2009. PMID: 19711376 Review.
Cited by
-
Synovial fluid proteome in rheumatoid arthritis.Clin Proteomics. 2016 Jun 5;13:12. doi: 10.1186/s12014-016-9113-1. eCollection 2016. Clin Proteomics. 2016. PMID: 27274716 Free PMC article.
-
Quantitative tissue proteomics of esophageal squamous cell carcinoma for novel biomarker discovery.Cancer Biol Ther. 2011 Sep 15;12(6):510-22. doi: 10.4161/cbt.12.6.16833. Epub 2011 Sep 15. Cancer Biol Ther. 2011. PMID: 21743296 Free PMC article.
-
Differentially expressed serum host proteins in hepatitis B and C viral infections.Virusdisease. 2018 Dec;29(4):468-477. doi: 10.1007/s13337-018-0484-y. Epub 2018 Sep 1. Virusdisease. 2018. PMID: 30539049 Free PMC article.
-
Large-scale quantitative glycoproteomics analysis of site-specific glycosylation occupancy.Mol Biosyst. 2012 Nov;8(11):2850-6. doi: 10.1039/c2mb25268f. Epub 2012 Aug 14. Mol Biosyst. 2012. PMID: 22892896 Free PMC article.
-
A comprehensive map of the human urinary proteome.J Proteome Res. 2011 Jun 3;10(6):2734-43. doi: 10.1021/pr2003038. Epub 2011 May 9. J Proteome Res. 2011. PMID: 21500864 Free PMC article.
References
-
- Parkin DM, Bray F, Ferlay J, Pisani P. Estimating the world cancer burden: Globocan 2000. Int J Cancer. 2001;94:153–6. - PubMed
-
- Reuben A. The crab, the turkey and a malignant tale from the year of the rooster. Hepatology. 2005;41:944–50. - PubMed
-
- Torbenson M, Kannangai R, Abraham S, Sahin F, et al. Concurrent evaluation of p53, beta-catenin, and alpha-fetoprotein expression in human hepatocellular carcinoma. Am J Clin Pathol. 2004;122:377–82. - PubMed
-
- Nakamura S, Nouso K, Sakaguchi K, Ito YM, et al. Sensitivity and specificity of des-gamma-carboxy prothrombin for diagnosis of patients with hepatocellular carcinomas varies according to tumor size. Am J Gastroenterol. 2006;101:2038–43. - PubMed
-
- Toyoda H, Kumada T, Kiriyama S, Sone Y, et al. Prognostic significance of simultaneous measurement of three tumor markers in patients with hepatocellular carcinoma. Clin Gastroenterol Hepatol. 2006;4:111–7. - PubMed
Grants and funding
LinkOut - more resources
Full Text Sources
Other Literature Sources
Research Materials